
Describing oscillation: period, frequency and amplitude
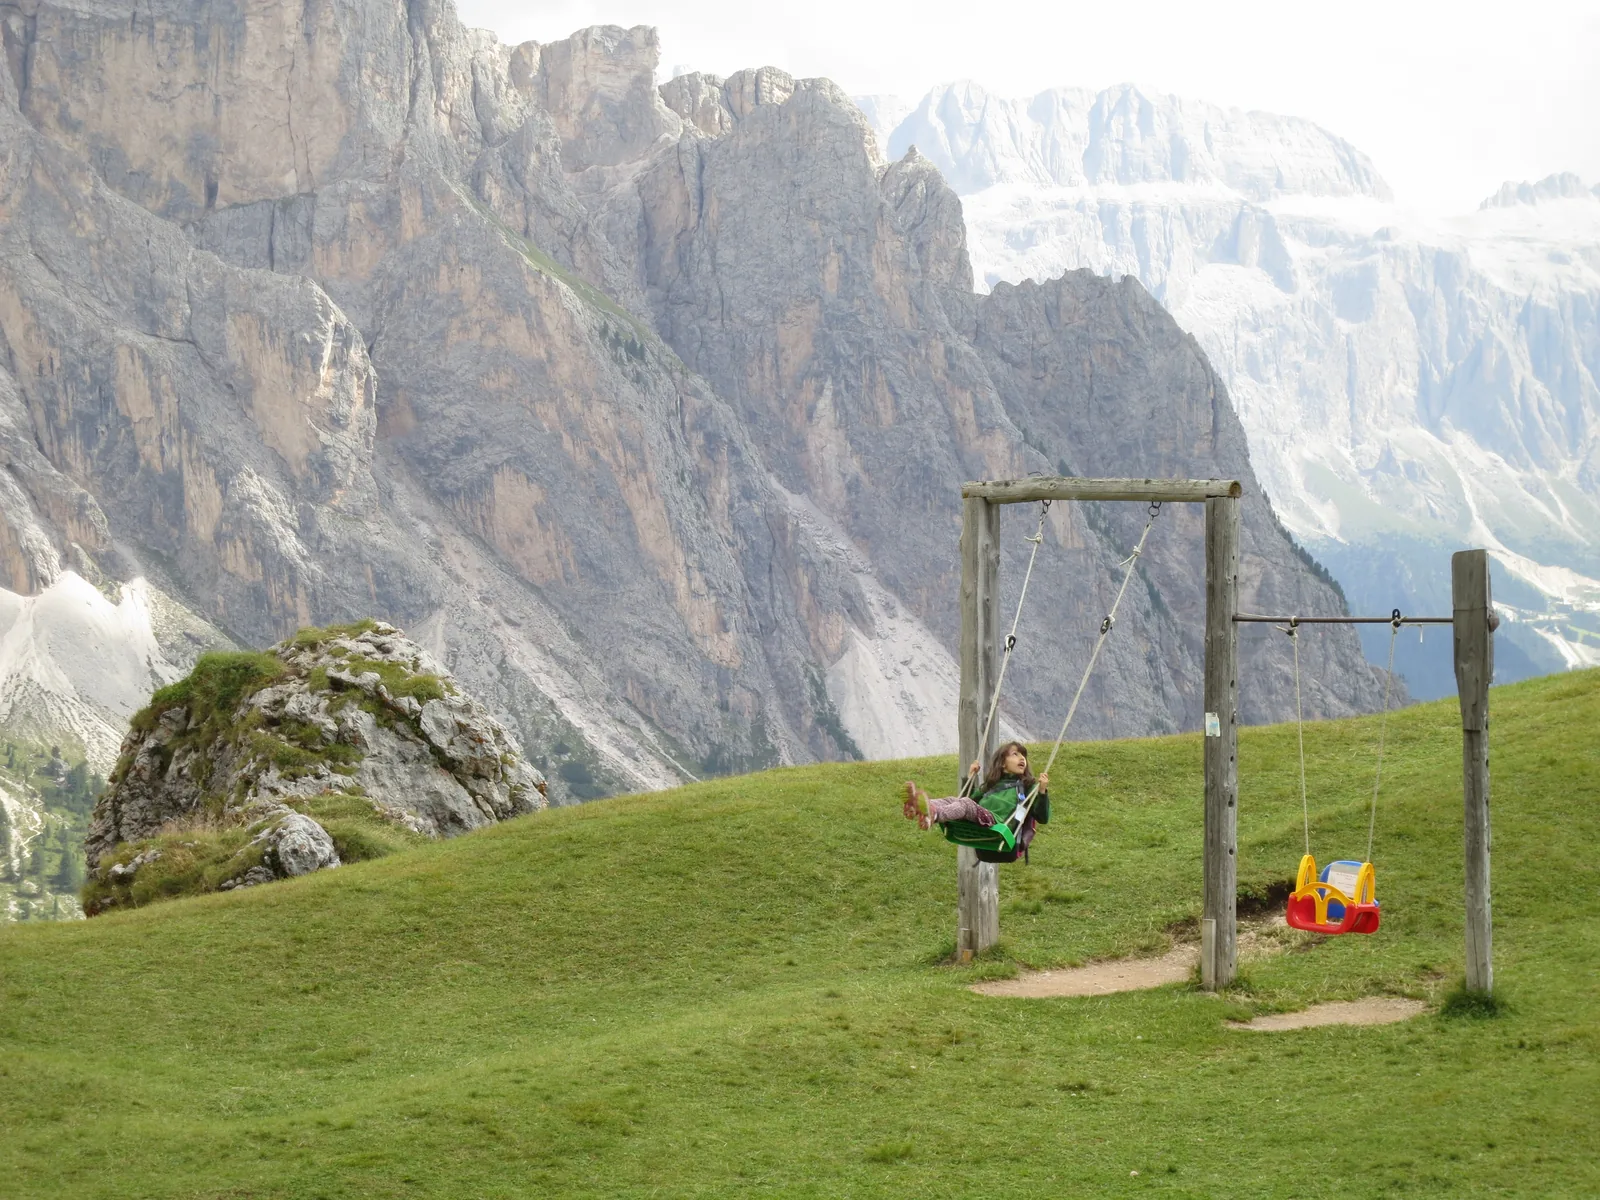
Why can the motion of a child on a swing be described with a few numbers, even though the swing is in a different place at every moment?
Prior knowledge
- The period $T$ is the duration of one revolution, and the rotation frequency $f = \tfrac{1}{T}$ is the number of revolutions per unit timechapter Moving in a circle: period and speed
- A $(t, x)$ graph shows the position of an object as a function of timechapter Position, velocity and uniform motion as graphs
Core path: follow the steps in order. Tasks marked Optional give extra practice. Optional tasks: 5.
Think about it
A weight hangs from a spring in a laboratory stand. When it is pulled down a little and released, it starts to bounce up and down. On the floor under the weight there is a motion sensor that measures the position of the weight twenty times a second. A wavy curve appears on the screen, and it seems to repeat itself.
With which numbers can such a motion be described, and how are they obtained from the curve?
Optional Recap: period and rotation frequency
Predict
Make your predictions before investigating 2 questions
Prediction 1: amplitude of the model
Prediction 2: period of the model
Investigate
Fit a sine curve to the simulated measurement. Adjust the amplitude and the period of the model until the blue curve goes through the middle of the black points.
Simulation
How to use
Choose Data set and adjust the amplitude $A$ and the period $T$ of the model. The blue curve is your model $x = A \sin\left(\tfrac{2\pi t}{T}\right)$, the black points are the simulated measurement. The reading Fit error $d$ tells how far the points are from the curve on average: the smaller $d$ is, the better the model fits. Start replays the measurement for $5\,\text{s}$: the weight moves as in the measurement, the blue triangle beside it shows the displacement of the model, and a dashed line marks the same moment in the graph. If the model fits, the triangle stays level with the weight all the time. The readings $N$ and $f$ concern the model. Speed changes only the pace of the replay.
Assumptions of the model
The weight oscillates vertically on a spring, and up is the positive direction. The oscillation does not die out, and timing starts when the weight passes the equilibrium position going up. Every data set is a simulated measurement: the points have been calculated from a sine model and a small random-looking error of at most $0.25\,\text{cm}$ has been added, as in a real measurement. This is why the points do not lie exactly on any sine curve and the fit error is never zero. All the numbers are values of the model and the simulation, not measured values.
How the calculation works
There are $51$ measured points, at intervals of a tenth of a second from $0$ to $5.0\,\text{s}$. The displacement of the model at the time $t$ is $x = A \sin\left(\tfrac{2\pi t}{T}\right)$, and the frequency is $f = \tfrac{1}{T}$. The fit error $d$ is the mean of the vertical distances between the points and the model curve: for each point $|x_i - A \sin\left(\tfrac{2\pi t_i}{T}\right)|$ is calculated, and the results are added together and divided by the number of points. $N$ is the number of full oscillations of the model between $0$ and $5.0\,\text{s}$, that is, the integer part of $\tfrac{5.0\,\text{s}}{T}$. The reading simulated measurement is the value of the nearest measured point.
Experiment 1: fitting the amplitude
Test prediction 1. The period of the model is the correct $1.60\,\text{s}$ of the data set and stays constant. Change only the amplitude of the model and record the fit error $d$ at least for the values $3.0\,\text{cm}$, $6.0\,\text{cm}$ and $12\,\text{cm}$. With which amplitude do the peaks of the curve meet the peaks of the points?
Initial state: data set: data set 1, amplitude of the model $A$ = $2\,\text{cm}$, period of the model $T$ = $1{.}6\,\text{s}$. Kept constant: data set, period of the model $T$. Varied: amplitude of the model $A$.
| amplitude of the model $A$ | $d$ $(\text{cm})$ |
|---|
Experiment 2: fitting the period
Test prediction 2. The amplitude of the model is $6.0\,\text{cm}$ and stays constant. Change only the period of the model and record at least the values $0.80\,\text{s}$ and $1.60\,\text{s}$. Watch how the number of peaks changes and for which period the fit error is the smallest.
Initial state: data set: data set 1, amplitude of the model $A$ = $6\,\text{cm}$, period of the model $T$ = $0{.}8\,\text{s}$. Kept constant: data set, amplitude of the model $A$. Varied: period of the model $T$.
| period of the model $T$ | $N$ | $f$ $(\text{Hz})$ | $d$ $(\text{cm})$ |
|---|
Experiment 3: fit it yourself
The amplitude and the period of data set 3 are not given. First read rough values from the graph: the amplitude from the level of the peaks of the points and the period from the duration of two full oscillations. Set them in the model and then fine-tune both until the fit error is the smallest. Record every attempt.
Initial state: data set: data set 3, amplitude of the model $A$ = $2\,\text{cm}$, period of the model $T$ = $1\,\text{s}$. Kept constant: data set. Varied: period of the model $T$.
| period of the model $T$ | $A$ $(\text{cm})$ | $f$ $(\text{Hz})$ | $d$ $(\text{cm})$ |
|---|
What is the period of data set 3 according to your best fit? Answer in seconds.
Hint 1: a guiding question
The best fit is the row where the fit error $d$ is the smallest. If it is more than $1\,\text{cm}$, the curve does not yet go through the middle of the points.
Hint 2: what is the connection
Read from the graph where the points pass the equilibrium position going up for the second time. That is the duration of one full oscillation.
Hint 3: an intermediate step
The points rise through the equilibrium position at the time $0$ and the next time a little after $2\,\text{s}$. Try values near it in the model and see where $d$ is the smallest.
Show the solution
Given
the simulated measured points of data set 3 and your own fit attempts in the table, the model $x = A \sin\left(\tfrac{2\pi t}{T}\right)$
Find
the period $T$ of the data set in seconds
Principle
The smaller the fit error $d$ is, the better the model fits the data. The best fit is the period of the model for which $d$ is the smallest, when the amplitude has also been adjusted suitably.
Reading the graph
The points pass the equilibrium position going up at the time $0$ and the next time at about $2.2\,\text{s}$, and the peaks are at about $8.5\,\text{cm}$. When $A = 8.5\,\text{cm}$ is set in the model and the period is adjusted, $d$ drops sharply at $2.20\,\text{s}$.
Formula
No calculation formula: the period is read directly from the row of the best fit, $T = T_\text{best}$.
Conversions
None needed: the control shows the period in seconds.
Substitution
The best row: $A = 8.5\,\text{cm}$, $T = 2.20\,\text{s}$, $f = 0.455\,\text{Hz}$ and $d = 0.13\,\text{cm}$, so $T = 2.20\,\text{s}$.
Answer
$2.2\,\text{s}$
To two significant figures, because the step $0.05\,\text{s}$ of the control and the scatter of the points limit the precision.
Reasonableness
The interval $0$–$5\,\text{s}$ holds $\tfrac{5.0\,\text{s}}{2.2\,\text{s}} \approx 2.3$ oscillations, that is, two full peaks and a little more, as in the graph. The fit error $d = 0.13\,\text{cm}$ is of the same order of magnitude as the error of the points, at most $0.25\,\text{cm}$, so a better fit cannot be expected. The numbers are values of the simulation.
Conclusion: what A and T do to the curve
Write on the basis of your tables: how do the amplitude and the period change the model curve? Where on the graph is the amplitude read? How did you find the amplitude and the period of data set 3, and why did the fit error not go to zero?
Model answer
The amplitude changes the curve vertically: in data set 1 the fit error was $0.13\,\text{cm}$ with $A = 6.0\,\text{cm}$, but $3.70\,\text{cm}$ with $12\,\text{cm}$ and $1.85\,\text{cm}$ with $3.0\,\text{cm}$. So the amplitude is read from the level of the equilibrium position to the level of a peak, not from a peak to a trough. The period changes the curve horizontally: with $T = 0.80\,\text{s}$ there were $6$ full oscillations in the interval $0$–$5\,\text{s}$ and the frequency was $1.25\,\text{Hz}$, with $1.60\,\text{s}$ only $3$ and the frequency was $0.625\,\text{Hz}$. In data set 3 I first read rough values from the graph and then fine-tuned until $d$ was the smallest: $A = 8.5\,\text{cm}$ and $T = 2.20\,\text{s}$, $d = 0.13\,\text{cm}$. The fit error does not go to zero because the simulated points contain a small error, as real measurements do. The numbers are values of the simulation.
Assess your own answer
Tick the points your own answer already contains.
Review the theory summary and practise with the exercises.
Theory summary
Key idea
Motion is periodic when it repeats in the same way at equal intervals of time. A uniformly rotating carousel (chapter Moving in a circle: period and speed), the pendulum of a pendulum clock, a swing and a weight bouncing on a spring all move periodically. The last three are also in oscillation: the object moves back and forth on both sides of the equilibrium position. The equilibrium position is the position where an object placed at rest stays at rest. A child on a carousel does not oscillate, although the motion is periodic, because the child goes round and does not move back and forth on both sides of one point.
The position of an oscillating object is described by the displacement $x$, that is, the distance of the object from the equilibrium position, with a sign. At the equilibrium position $x = 0$, and one direction is chosen as positive, for the weight on a spring for example up. The greatest displacement is the amplitude $A$. It is measured from the equilibrium position to an extreme position, not from one extreme position to the other: the distance between the highest and the lowest position is $2A$. In this chapter the oscillation is assumed not to die out, so the amplitude stays the same.
Period and frequency
The period $T$ is the duration of one full oscillation (one cycle): the time after which the object is again in the same place and moving in the same direction. When the weight leaves the equilibrium position going up, it reaches the highest position, returns to the equilibrium position, reaches the lowest position and returns to the equilibrium position again. This is one oscillation. The frequency $f$ is the number of full oscillations per unit time. The period and the frequency correspond to the period and the rotation frequency in the chapter Moving in a circle: period and speed: one oscillation corresponds to one revolution. The period is measured most precisely from the duration of several oscillations: if $n$ oscillations take the time $t_n$, the period is $T = \tfrac{t_n}{n}$.
An oscillation as a graph
When the displacement is drawn as a function of time, the result is a $(t, x)$ graph (chapter Position, velocity and uniform motion as graphs). The graph of periodic motion repeats in the same way at intervals of one period. The period is read between two successive peaks or between two passes through the equilibrium position in which the object moves in the same direction. Successive passes are only half a period apart, because the object passes the equilibrium position once going up and once coming down. The amplitude is read from the level $x = 0$ of the equilibrium position to the level of a peak.
Sinusoidal oscillation
The frequency is the reciprocal of the period, because one oscillation takes the time $T$, and in a unit of time $\tfrac{1}{T}$ oscillations are completed:
$$f = \frac{1}{T}$$
where $f$ is the frequency ($\text{Hz}$) and $T$ the period ($\text{s}$). The unit of frequency is the hertz, $1\,\text{Hz} = 1\,\tfrac{1}{\text{s}}$. When the period is $T = 0.50\,\text{s}$, the object makes $2.0$ oscillations per second, that is, $f = 2.0\,\text{Hz}$.
The $(t, x)$ graph of many oscillating objects is a sine curve. This is so, for example, for a weight oscillating on a spring and for a pendulum swinging through small angles; the reason becomes clear later in the course from the forces acting on the oscillating object. When timing starts at the moment the object passes the equilibrium position in the positive direction, the displacement is
$$x = A \sin\left(\frac{2\pi t}{T}\right) = A \sin(2\pi f t)$$
where $x$ is the displacement from the equilibrium position, $A$ the amplitude (in the same unit as $x$), $t$ the time ($\text{s}$), $T$ the period ($\text{s}$) and $f$ the frequency ($\text{Hz}$). The argument of the sine is in radians, so the calculator must be set to radian mode.
Why exactly $2\pi \tfrac{t}{T}$?
The expression comes from circular motion. A point moves uniformly anticlockwise round a circle of radius $A$ with the period $T$, and it starts from the right-hand end of the horizontal radius, from which the angle $2\pi \tfrac{t}{T}$ is measured. In the time $t$ the point goes round the fraction $\tfrac{t}{T}$ of a revolution. A whole revolution is $2\pi$ radians, so the radius turns through the angle $2\pi \tfrac{t}{T}$, and the height of the point above the level of the centre is $A \sin\left(2\pi \tfrac{t}{T}\right)$. So the height of the point oscillates exactly like the displacement of an oscillating object. At the time $t = \tfrac{T}{4}$ the angle is $\tfrac{\pi}{2}$ and $x = A$, at $\tfrac{T}{2}$ again $x = 0$, at $\tfrac{3T}{4}$ $x = -A$ and at $T$ again $x = 0$.
Fitting a sine function
In real series of measurements the measured points do not usually lie exactly on a sine curve because of measurement uncertainty. In fitting a sine function one looks for the values of $A$ and $T$ for which the curve $x = A \sin\left(\tfrac{2\pi t}{T}\right)$ goes through the middle of the set of points. When fitting by hand, the amplitude is half of the difference between the levels of the highest and the lowest points. The period is read from the duration of several full oscillations and divided by the number of oscillations, because then the inaccuracy of reading is shared among many periods. In the simulated points of the figure three oscillations take $3.6\,\text{s}$, so $T = \tfrac{3.6\,\text{s}}{3} = 1.2\,\text{s}$, and the amplitude is about $3.0\,\text{cm}$.
Graphical Analysis Pro fits a sine function from the same menu as a line: Curve Fit of the graph tools, from whose drop-down menu the sine function (Sine) is chosen. The model of the program is $y = A \sin(Bt + C) + D$. Here $A$ is the amplitude and $B = \tfrac{2\pi}{T}$, so the period is $T = \tfrac{2\pi}{B}$. The constant $D$ is the reading at the equilibrium position, for example the distance of the weight from the motion sensor when the weight is at the equilibrium position. The constant $C$ tells the phase at the time $t = 0$, that is, at which point of the oscillation the object was when timing started. When timing starts at a pass through the equilibrium position in the positive direction, $C = 0$; in the tasks of this chapter timing always starts like this.
Common misconception
Many take the amplitude to be the distance between the highest and the lowest position. The amplitude, however, is the greatest displacement from the equilibrium position, so it is half of the distance between the extreme positions. If the weight moves $12\,\text{cm}$ from the highest position to the lowest, the amplitude is $6.0\,\text{cm}$.
A common error when reading a graph is to measure the period between two successive passes through the equilibrium position. Between them the object moves in opposite directions, so the interval is only half of the period. A full period is between two successive peaks.
In calculations the period and the frequency are easily mixed up. The longer the period is, the lower the frequency is, because $f = \tfrac{1}{T}$. When the value of a sine is calculated, the calculator must be in radian mode: in the example, $\sin 2.618$ calculated in degrees is about $0.046$, and the displacement would wrongly come out as about $0.18\,\text{cm}$.
Summary
- Periodic motion repeats in the same way at equal intervals of time. In an oscillation an object moves back and forth on both sides of the equilibrium position.
- The displacement $x$ is the distance from the equilibrium position, with a sign. The amplitude $A$ is the greatest displacement, and the distance between the extreme positions is $2A$.
- The period $T$ is the duration of one full oscillation, and the frequency $f = \tfrac{1}{T}$ is the number of oscillations per unit time; the unit is $1\,\text{Hz} = 1\,\tfrac{1}{\text{s}}$.
- When timing starts at a pass through the equilibrium position in the positive direction, a sinusoidal oscillation is described by $x = A \sin\left(\tfrac{2\pi t}{T}\right) = A \sin(2\pi f t)$, with the argument in radians.
- In fitting a sine function the amplitude and the period are chosen so that the curve goes through the middle of the set of measured points; the period is read from the duration of several oscillations.
Optional Return to your predictions
Compare your predictions with your tables and the formula $x = A \sin\left(\tfrac{2\pi t}{T}\right)$. Then return to the opening question: with which numbers is the motion of a weight bouncing on a spring described, and how are they read from the curve drawn by the motion sensor?
Would you change your prediction?
Apply
Worked example
Problem
A weight oscillating on a spring reaches $4.0\,\text{cm}$ above the equilibrium position at its highest and just as much below it at its lowest. The weight makes $5$ full oscillations in $3.0\,\text{s}$. Timing starts when the weight passes the equilibrium position going up, and up is the positive direction. How far from the equilibrium position is the weight at the time $t = 0.25\,\text{s}$, and on which side?
Step 1/7
Given and find. Amplitude $A = 4.0\,\text{cm}$ (the greatest displacement from the equilibrium position), number of oscillations $n = 5$, their duration $t_n = 3.0\,\text{s}$ and the moment $t = 0.25\,\text{s}$. The displacement $x$ at the time $t$ is asked.
Step 2/7
Principle. The weight oscillates periodically, and the oscillation is assumed to be sinusoidal and undamped. Timing starts at a pass through the equilibrium position in the positive direction, so the displacement is described by the model $x = A \sin\left(\tfrac{2\pi t}{T}\right)$. The period is the duration of one oscillation, so it is obtained by dividing the duration of five oscillations by five.
Step 3/7
Formula solved.
$$\begin{aligned} T &= \frac{t_n}{n} \\ x &= A \sin\left(\frac{2\pi t}{T}\right) \end{aligned}$$
Step 4/7
Conversions. None needed: the times are in seconds, so the argument of the sine becomes a dimensionless number in radians, and $x$ comes out in centimetres like the amplitude. The calculator is set to radian mode.
Step 5/7
Substitution. $$\begin{aligned} T &= \frac{t_n}{n} \\ &= \frac{3.0\,\text{s}}{5} = 0.60\,\text{s} \\ x &= A \sin\left(\frac{2\pi t}{T}\right) \\ &= 4.0\,\text{cm} \cdot \sin\left(\frac{2\pi \cdot 0.25\,\text{s}}{0.60\,\text{s}}\right) \\ &= 4.0\,\text{cm} \cdot \sin 2.618 \\ &= 4.0\,\text{cm} \cdot 0.500 \\ &= 2.0\,\text{cm} \end{aligned}$$
Step 6/7
Answer. The weight is $2.0\,\text{cm}$ above the equilibrium position, because the displacement is positive. The result is given to two significant figures, like the amplitude $4.0\,\text{cm}$ and the time $3.0\,\text{s}$.
Step 7/7
Reasonableness. The period is $0.60\,\text{s}$, so the weight is at its highest position at the time $\tfrac{T}{4} = 0.15\,\text{s}$ and returns to the equilibrium position at $\tfrac{T}{2} = 0.30\,\text{s}$. The moment $0.25\,\text{s}$ is between these, so the weight is on its way down from the highest position to the equilibrium position, and the displacement must be between zero and $4.0\,\text{cm}$. The result $2.0\,\text{cm}$ satisfies this.
Optional Find the error
Optional Extra: phase
Apply to a new situation
The deck of a light footbridge oscillates vertically when people run on the bridge in step. The amplitude of the oscillation is $4.0\,\text{cm}$ and the frequency $0.50\,\text{Hz}$, and the oscillation is assumed to be sinusoidal and undamped.
How far from the equilibrium position is the deck $0.40\,\text{s}$ after it passed the equilibrium position going up? Answer in centimetres.
Hint 1: a guiding question
Timing starts at a pass through the equilibrium position going up, so you can use the sine model. Which form fits when you know the frequency?
Hint 2: what is the connection
$x = A \sin(2\pi f t)$. First calculate the argument $2\pi f t$ and check that the calculator is in radian mode.
Hint 3: an intermediate step
$2\pi \cdot 0.50\,\text{Hz} \cdot 0.40\,\text{s} = 1.257$, so $x = 4.0\,\text{cm} \cdot \sin 1.257$.
Show the solution
Given
amplitude $A = 4.0\,\text{cm}$, frequency $f = 0.50\,\text{Hz}$, time from the pass through the equilibrium position $t = 0.40\,\text{s}$
Find
the displacement $x$ of the deck from the equilibrium position in centimetres
Principle
The deck oscillates sinusoidally, and the time is counted from the moment when it passed the equilibrium position going in the positive direction, up. Then the displacement is described by the sine model, where the frequency can be used in place of the period because $\tfrac{1}{T} = f$.
Formula
$$x = A \sin(2\pi f t)$$
Conversions
None needed: $\text{Hz} \cdot \text{s} = \tfrac{1}{\text{s}} \cdot \text{s}$ is dimensionless, so the argument is in radians, and $x$ comes out in centimetres like $A$.
Substitution
Answer
$3.8\,\text{cm}$
Above the equilibrium position, two significant figures as in the amplitude $4.0\,\text{cm}$ and the frequency $0.50\,\text{Hz}$.
Reasonableness
The period is $T = \tfrac{1}{f} = 2.0\,\text{s}$, so the deck is at its highest position at $\tfrac{T}{4} = 0.50\,\text{s}$. The time $0.40\,\text{s}$ is a little before that, so the deck is already near the highest position: the displacement $3.8\,\text{cm}$ is a little less than the amplitude $4.0\,\text{cm}$, as it should be.
Check your understanding
Exit ticket
Answer on your own first and only then open the answer.
- The displacement of a weight is $x = 3.0\,\text{cm} \cdot \sin\left(\dfrac{2\pi t}{0.50\,\text{s}}\right)$. What are the amplitude, the period and the frequency of the oscillation?
Answer
The model $x = A \sin\left(\tfrac{2\pi t}{T}\right)$ is compared with the expression: the amplitude is $A = 3.0\,\text{cm}$ and the period $T = 0.50\,\text{s}$. The frequency is
$f$$= \dfrac{1}{T}$$= \dfrac{1}{0.50\,\text{s}}$$= 2.0\,\text{Hz}$ - The motion of a child standing at the edge of a uniformly rotating carousel is periodic. Why is it not oscillation?
Answer
The motion is periodic because it repeats in the same way on every revolution. In an oscillation an object moves back and forth on both sides of the equilibrium position, but the child on the carousel goes round a circle in the same direction and does not move back and forth around any position.
1. Concept
2. Frequency from a graph
The graph shows the horizontal displacement of the bob of a pendulum as a function of time according to the sine model.
What is the frequency of the pendulum? Answer in hertz.
Hint 1: a guiding question
Find the points on the graph where the curve passes the equilibrium position going up. How many full oscillations are there in the graph?
Hint 2: what is the connection
Read the duration of several full oscillations and divide by the number of oscillations: $T = \tfrac{t_n}{n}$. Then $f = \tfrac{1}{T}$.
Hint 3: an intermediate step
The curve rises through the equilibrium position at the times $0$, $1.8\,\text{s}$, $3.6\,\text{s}$ and $5.4\,\text{s}$.
Show the solution
Given
from the graph, the displacement $x$ of the pendulum as a function of time from $0$ to $5.4\,\text{s}$
Find
the frequency $f$ of the pendulum in hertz
Principle
The period is the duration of one full oscillation. It is read most precisely from the duration of several oscillations and divided by their number, and the frequency is the reciprocal of the period.
Reading the graph
The curve starts from zero going up and passes the equilibrium position going up the next times at $1.8\,\text{s}$, $3.6\,\text{s}$ and $5.4\,\text{s}$. So the graph has $n = 3$ full oscillations in the time $t_n = 5.4\,\text{s}$. The passes in between, at $0.9\,\text{s}$, $2.7\,\text{s}$ and $4.5\,\text{s}$, are going down.
Formula
$T = \dfrac{t_n}{n}$ and $f = \dfrac{1}{T}$, from which
$$f = \frac{n}{t_n}$$
Conversions
None needed: the time is in seconds, so the frequency comes out in the unit $\tfrac{1}{\text{s}} = \text{Hz}$.
Substitution
Answer
$0.56\,\text{Hz}$
Two significant figures as in the time $5.4\,\text{s}$ read from the graph.
Reasonableness
One oscillation takes $1.8\,\text{s}$, so a little more than half an oscillation is completed in a second, which fits the result $0.56\,\text{Hz}$. A pendulum about $0.8\,\text{m}$ long swings at this pace, so the result is believable.
Suggestion: one answer does not show everything you can do, but review the theory summary and do the core exercises.
Optional 3. Interpret a fit
A motion sensor measures the distance to a weight oscillating on a spring. Suppose that the sine fit $y = A \sin(Bt + C) + D$ of Graphical Analysis Pro gives the values $A = 0.052\,\text{m}$, $B = 7.85\,\tfrac{1}{\text{s}}$, $C = 0.01$ and $D = 0.430\,\text{m}$.
What does each number tell about the motion of the weight, and what are the period and the frequency of the oscillation?
Model answer
The amplitude $A = 0.052\,\text{m} = 5.2\,\text{cm}$ is the greatest displacement of the weight from the equilibrium position. The constant $D = 0.430\,\text{m}$ is the distance from the sensor to the equilibrium position, so the weight moves between the distances $0.378\,\text{m}$ and $0.482\,\text{m}$. From the constant $B = \tfrac{2\pi}{T}$ the period is $T = \tfrac{2\pi}{7.85\,\tfrac{1}{\text{s}}} = 0.800\,\text{s}$ and the frequency $f = \tfrac{1}{T} = 1.25\,\text{Hz}$. The constant $C \approx 0$ tells the phase: at the time $t = 0$ the weight was at the equilibrium position and moving in the positive direction, that is, away from the sensor, because the distance started to increase.
Assess your own answer
Tick the points your own answer already contains.
Review the theory summary and practise with the exercises.
Review the chapter's concepts
Cards you mark Review later collect in your review deck.
- Periodic motion
- Motion in which the same state of motion repeats at regular intervals.
- Oscillator
- An object or system that oscillates.
- Amplitude
- The largest displacement of the oscillator from the equilibrium position.
- Period
- The time for one full oscillation.$$T = \dfrac{1}{f}$$
- Frequency
- The number of full oscillations per unit time.$$f = \dfrac{1}{T}$$
Exercises
Level 1 · basic practice 5 exercises
One formula or one step of reasoning. Core exercises first, the rest is extra practice.
- Exercise 7-1Core
The period of a weight oscillating on a spring is $0.40\,\text{s}$. What is the frequency of the oscillation?
Answer
$2.5\,\text{Hz}$
Show the solution
Given
period $T = 0.40\,\text{s}$
Find
the frequency $f$ of the oscillation in $\text{Hz}$
Principle
The frequency is the number of full oscillations per unit time. When one oscillation takes the time $T$, $\tfrac{1}{T}$ oscillations are completed in a second, so the frequency is the reciprocal of the period.
Formula
$f = \dfrac{1}{T}$
Conversions
None needed: the period is in seconds, so the frequency comes out in the unit $\tfrac{1}{\text{s}} = \text{Hz}$.
Substitution
$f$$= \dfrac{1}{0.40\,\text{s}}$$= 2.5\,\text{Hz}$Answer
$2.5\,\text{Hz}$
Two significant figures as in the period $0.40\,\text{s}$.
Reasonableness
Check in the other direction: $2.5$ oscillations per second means that one oscillation takes $\tfrac{1\,\text{s}}{2.5} = 0.40\,\text{s}$, as in the task. A weight bouncing on a spring often makes a few oscillations per second, so the order of magnitude fits.
- Exercise 7-2Core
A guitar string vibrates at the frequency $196\,\text{Hz}$. What is the period of the vibration of the string? Give the answer in milliseconds.
Answer
$5.10\,\text{ms}$
Show the solution
Given
frequency $f = 196\,\text{Hz}$
Find
the period $T$ in milliseconds
Principle
The period is the duration of one oscillation, and the frequency is the number of oscillations per second. They are reciprocals of each other, so the period is obtained by solving it from the formula of the frequency.
Formula
$f = \dfrac{1}{T}$, from which $T = \dfrac{1}{f}$
Conversions
$1\,\text{Hz} = 1\,\tfrac{1}{\text{s}}$, so the period comes out in seconds; finally $1\,\text{s} = 1000\,\text{ms}$.
Substitution
$T$$= \dfrac{1}{196\,\tfrac{1}{\text{s}}}$$= 0.005102\,\text{s}$$= 0.005102 \cdot 1000\,\text{ms}$$= 5.102\,\text{ms}$Answer
$5.10\,\text{ms}$
Three significant figures as in the frequency $196\,\text{Hz}$.
Reasonableness
An estimate with round numbers: at the frequency $200\,\text{Hz}$ the period would be $\tfrac{1}{200}\,\text{s} = 5\,\text{ms}$. The frequency is a little lower, so the period is a little longer, like $5.10\,\text{ms}$. The vibration of a string is so fast that the eye cannot follow it, which fits the order of magnitude of milliseconds.
- Exercise 7-3
The graph shows the displacement of a weight oscillating on a spring as a function of time. What is the amplitude of the oscillation?
Answer
$2.5\,\text{cm}$
Show the solution
Given
a graph of the displacement $x$ of a weight as a function of time $t$ from $0$ to $3.0\,\text{s}$
Find
the amplitude $A$ of the oscillation in centimetres
Principle
The amplitude is the greatest displacement from the equilibrium position. At the equilibrium position $x = 0$, so the amplitude is read from the level of the dashed line $x = 0$ to the level of a peak of the curve, not from a peak to a trough.
Reading the graph
The peaks of the curve are at the grid line between $2$ and $3$ on the vertical axis, that is, at $x = 2.5\,\text{cm}$, and the troughs correspondingly at $x = -2.5\,\text{cm}$. So a peak is $2.5\,\text{cm}$ above the equilibrium position.
Formula
$A = x_\text{peak} - 0$, that is, $A = x_\text{peak}$
Conversions
None needed: the values of the vertical axis are in centimetres.
Substitution
$A$$= 2.5\,\text{cm} - 0\,\text{cm}$$= 2.5\,\text{cm}$Answer
$2.5\,\text{cm}$
Two significant figures, because the value is read from a half-centimetre grid line.
Reasonableness
Another route: the distance between a peak and a trough is $2.5\,\text{cm} - (-2.5\,\text{cm}) = 5.0\,\text{cm}$, and the amplitude is half of it, $2.5\,\text{cm}$. The value $5.0\,\text{cm}$ would be the distance $2A$ between the extreme positions.
- Exercise 7-4
The pendulum of a pendulum clock makes $20$ full swings in $36\,\text{s}$. What is the period of the pendulum?
Answer
$1.8\,\text{s}$
Show the solution
Given
number of full swings $n = 20$, their duration $t_n = 36\,\text{s}$
Find
the period $T$ of the pendulum in seconds
Principle
The period is the duration of one full swing. When the swings are alike, one takes the fraction $\tfrac{1}{n}$ of the duration of all of them. A period calculated from the time of several swings is more precise than a measurement of one swing.
Formula
$T = \dfrac{t_n}{n}$
Conversions
None needed: the time is in seconds, and the number of swings is a dimensionless number.
Substitution
$T$$= \dfrac{36\,\text{s}}{20}$$= 1.8\,\text{s}$Answer
$1.8\,\text{s}$
Two significant figures as in the time $36\,\text{s}$; the number of swings $20$ is counted exactly.
Reasonableness
Check by multiplying: $20 \cdot 1.8\,\text{s} = 36\,\text{s}$. The frequency is $\tfrac{1}{1.8\,\text{s}} \approx 0.56\,\text{Hz}$, so the pendulum makes a little over half a swing per second, which fits the long pendulum of a floor-standing pendulum clock.
- Exercise 7-5
A weight oscillates on a spring, and the amplitude of the oscillation is $4.0\,\text{cm}$. How far does the weight travel during one period?
Answer
$16\,\text{cm}$
Show the solution
Given
amplitude $A = 4.0\,\text{cm}$
Find
the distance $s$ travelled during one period in centimetres
Principle
During one full oscillation the weight leaves the equilibrium position, rises to the highest position (distance $A$), falls to the lowest position (distance $2A$) and returns to the equilibrium position (distance $A$). The distance travelled is the sum of these, although the weight ends up at the same place from which it started.
Formula
$s = A + 2A + A$, that is, $s = 4A$
Conversions
None needed: the amplitude is in centimetres, and the answer is asked in centimetres.
Substitution
$s$$= 4 \cdot 4.0\,\text{cm}$$= 16\,\text{cm}$Answer
$16\,\text{cm}$
Two significant figures as in the amplitude $4.0\,\text{cm}$.
Reasonableness
The distance between the extreme positions is $2A = 8.0\,\text{cm}$, and during a period the weight travels it twice, up and down: $2 \cdot 8.0\,\text{cm} = 16\,\text{cm}$. The displacement of the weight during a period is, however, zero, because it returns to its starting place.
Level 2 · applied practice 4 exercises
Two steps, working with measured data, a unit conversion or rearranging a formula. Core exercises first, the rest is extra practice.
- Exercise 7-6Core
A cart on an air track is attached between two springs and oscillates along the track. The graph shows the displacement of the cart from the equilibrium position as a function of time according to the sine model.
What is the displacement of the cart from the equilibrium position at the time $0.10\,\text{s}$?
Answer
$2.9\,\text{cm}$
Show the solution
Given
a graph of the displacement $x$ of a cart as a function of time $t$ according to the sine model, time $t = 0.10\,\text{s}$
Find
the displacement $x$ of the cart from the equilibrium position in centimetres at the moment $t$
Principle
The graph is a sine curve that starts from the equilibrium position going up, so the displacement is described by the model $x = A \sin\left(\tfrac{2\pi t}{T}\right)$. The coefficients $A$ and $T$ of the model are read from the graph, and then the displacement is calculated at the desired moment.
Reading the graph
The peaks are at the grid line $x = 3.0\,\text{cm}$, so $A = 3.0\,\text{cm}$. The curve passes the equilibrium position going up at the times $0$, $0.50\,\text{s}$ and $1.0\,\text{s}$, so one oscillation takes $T = 0.50\,\text{s}$. The value at the time $0.10\,\text{s}$ cannot be read accurately from the graph, because there is no grid line there, so it is calculated.
Formula
$x$$= A \sin\left(\dfrac{2\pi t}{T}\right)$Conversions
None needed: the time is in seconds and the amplitude in centimetres. The calculator is set to radian mode.
Substitution
$x$$= 3.0\,\text{cm} \cdot \sin\left(\dfrac{2\pi \cdot 0.10\,\text{s}}{0.50\,\text{s}}\right)$$= 3.0\,\text{cm} \cdot \sin 1.257$$= 3.0\,\text{cm} \cdot 0.951$$= 2.85\,\text{cm}$Answer
$2.9\,\text{cm}$
On the positive side of the equilibrium position, two significant figures as in the values $3.0\,\text{cm}$ and $0.50\,\text{s}$ read from the graph.
Reasonableness
The cart is at an extreme position at the time $\tfrac{T}{4} = 0.125\,\text{s}$, so at $0.10\,\text{s}$ it is just before the peak and the displacement must be a little less than the amplitude $3.0\,\text{cm}$, like $2.9\,\text{cm}$. Another route: $0.10\,\text{s}$ is $\tfrac{0.10}{0.50} = 0.20$ of the period, that is, $72^\circ$, and $3.0\,\text{cm} \cdot \sin 72^\circ = 2.85\,\text{cm}$.
- Exercise 7-7Core
The sine fit $y = A \sin(Bt + C) + D$ of Graphical Analysis Pro gave the coefficient $B = 12.6\,\tfrac{1}{\text{s}}$ for the measurement of an oscillating weight. What is the frequency of the oscillation?
Answer
$2.01\,\text{Hz}$
Show the solution
Given
coefficient of the sine fit $B = 12.6\,\tfrac{1}{\text{s}}$
Find
the frequency $f$ of the oscillation in hertz
Principle
In the fit model $y = A \sin(Bt + C) + D$ the coefficient $B$ corresponds to the expression $\tfrac{2\pi}{T}$ of the sine model, because during one period the argument of the sine grows by $2\pi$. The frequency is obtained from the period as its reciprocal.
Formula
$B = \dfrac{2\pi}{T}$, from which $T = \dfrac{2\pi}{B}$, and $f = \dfrac{1}{T}$, so $f = \dfrac{B}{2\pi}$
Conversions
None needed: the coefficient $B$ is in the unit $\tfrac{1}{\text{s}}$, so the frequency comes out in the unit $\tfrac{1}{\text{s}} = \text{Hz}$.
Substitution
$f$$= \dfrac{12.6\,\tfrac{1}{\text{s}}}{2\pi}$$= \dfrac{12.6\,\tfrac{1}{\text{s}}}{6.283}$$= 2.005\,\text{Hz}$Answer
$2.01\,\text{Hz}$
Three significant figures as in the coefficient $12.6\,\tfrac{1}{\text{s}}$.
Reasonableness
An estimate: $2\pi \approx 6.3$, and $12.6$ is twice $6.3$, so the frequency must be about $2\,\text{Hz}$. The period is then about $0.50\,\text{s}$, which is usual for a weight oscillating on a spring.
- Exercise 7-8
The needle of a sewing machine moves up and down $900$ times a minute.
What is the period of the motion of the needle? Give the answer in milliseconds.
Answer
$67\,\text{ms}$
Show the solution
Given
the needle moves up and down $900$ times a minute
Find
the period $T$ of the motion of the needle in milliseconds
Principle
One up-and-down motion is one full oscillation, so the number of motions per unit time is the frequency. The period is the reciprocal of the frequency. The frequency is first converted to oscillations per second.
Formula
$f = \dfrac{1}{T}$, from which $T = \dfrac{1}{f}$
Conversions
$f$$= 900\,\tfrac{1}{\text{min}}$$= \dfrac{900}{60\,\text{s}}$$= 15\,\text{Hz}$finally $1\,\text{s} = 1000\,\text{ms}$.
Substitution
$T$$= \dfrac{1}{15\,\tfrac{1}{\text{s}}}$$= 0.06667\,\text{s}$$= 0.06667 \cdot 1000\,\text{ms}$$= 66.67\,\text{ms}$Answer
$67\,\text{ms}$
Two significant figures, because the rate $900$ times a minute is given as a round number.
Reasonableness
Another route: a minute has $60\,000\,\text{ms}$, and it is divided among $900$ motions, so one takes $\tfrac{60\,000\,\text{ms}}{900} \approx 67\,\text{ms}$. So the needle moves about $15$ times a second, which fits the fast whirr of a sewing machine.
- Exercise 7-9
A motion sensor measures the distance to a weight oscillating on a spring. The smallest measured distance is $32.0\,\text{cm}$ and the greatest $47.0\,\text{cm}$.
What is the amplitude of the oscillation?
Answer
$7.50\,\text{cm}$
Show the solution
Given
smallest distance from the sensor $d_\text{min} = 32.0\,\text{cm}$, greatest $d_\text{max} = 47.0\,\text{cm}$
Find
the amplitude $A$ of the oscillation in centimetres
Principle
The smallest and the greatest distance are the extreme positions of the weight. The distance between them is twice the amplitude, because the equilibrium position is halfway between the extreme positions and the amplitude is measured from the equilibrium position to an extreme position.
Formula
$d_\text{max} - d_\text{min} = 2A$, from which
$A$$= \dfrac{d_\text{max} - d_\text{min}}{2}$Conversions
None needed: both distances are in centimetres.
Substitution
$A$$= \dfrac{47.0\,\text{cm} - 32.0\,\text{cm}}{2}$$= \dfrac{15.0\,\text{cm}}{2}$$= 7.50\,\text{cm}$Answer
$7.50\,\text{cm}$
Three significant figures as in the difference of the distances $15.0\,\text{cm}$.
Reasonableness
The equilibrium position is at the distance $\tfrac{32.0\,\text{cm} + 47.0\,\text{cm}}{2} = 39.5\,\text{cm}$. From it to each extreme position is $7.50\,\text{cm}$: $39.5\,\text{cm} - 7.50\,\text{cm} = 32.0\,\text{cm}$ and $39.5\,\text{cm} + 7.50\,\text{cm} = 47.0\,\text{cm}$, as measured.
Level 3 · challenging 3 exercises
Optional: application, two ideas together or a new situation where you reason for yourself.
- Exercise 7-10
A weight oscillates sinusoidally with the period $1.2\,\text{s}$, and timing starts when it passes the equilibrium position going up.
How long does it take before the weight is for the first time at half the amplitude above the equilibrium position?
Answer
$0.10\,\text{s}$
Show the solution
Given
period $T = 1.2\,\text{s}$, timing starts at a pass through the equilibrium position going up, the height asked about $x = \tfrac{A}{2}$
Find
the time $t$ after which the weight is for the first time at the height $\tfrac{A}{2}$
Principle
The oscillation is sinusoidal, and timing starts at a pass through the equilibrium position in the positive direction, so $x = A \sin\left(\tfrac{2\pi t}{T}\right)$. When $x = \tfrac{A}{2}$, the value of the sine is $\tfrac{1}{2}$. The first time corresponds to the smallest positive angle for which the sine is $\tfrac{1}{2}$. In a right triangle with an angle of $30^\circ$ the opposite leg is half of the hypotenuse, so $\sin 30^\circ = \tfrac{1}{2}$, and because $180^\circ = \pi$, the angle is $30^\circ = \tfrac{\pi}{6}$. The next angle, $150^\circ$, would fall only in the downward phase. The amplitude cancels, so it is not needed.
Formula
$\dfrac{A}{2}$$= A \sin\left(\dfrac{2\pi t}{T}\right)$from which $\dfrac{2\pi t}{T} = \dfrac{\pi}{6}$, so $t = \dfrac{T}{12}$
Conversions
None needed: the period is in seconds, and the angle is in radians.
Substitution
$t$$= \dfrac{1.2\,\text{s}}{12}$$= 0.10\,\text{s}$Answer
$0.10\,\text{s}$
Two significant figures as in the period $1.2\,\text{s}$.
Reasonableness
The weight is at the highest position at $\tfrac{T}{4} = 0.30\,\text{s}$. Half of the height is reached already in a third of this time, because the weight moves fastest at the equilibrium position and slows down towards the highest position. Check:
$1.2\,\text{s} \cdot \tfrac{1}{12}$$= 0.10\,\text{s}$$\sin\left(\tfrac{2\pi \cdot 0.10}{1.2}\right)$$= \sin 0.524$$= 0.500$ - Exercise 7-11
A button is fixed to a disc rotating in a vertical plane at $15\,\text{cm}$ from the axis, and the disc rotates uniformly at $45$ revolutions per minute. The disc is lit from the side by horizontal, parallel light coming from far away, so the shadow of the button moves up and down on the wall beside it.
How far from the middle of its motion is the shadow $0.20\,\text{s}$ after it passed the middle going up?
Answer
$12\,\text{cm}$
Show the solution
Given
distance of the button from the axis $r = 15\,\text{cm}$, rotation frequency $45\,\tfrac{1}{\text{min}}$, time from the pass through the middle $t = 0.20\,\text{s}$
Find
the distance $x$ of the shadow from the middle of its motion in centimetres
Principle
The button is in uniform circular motion, and the horizontal light casts on the wall its height above the level of the axis. The height of a point in circular motion oscillates sinusoidally: the amplitude is the radius of the circle and the frequency is the rotation frequency. The light comes from far away and is parallel, so the shadow is as large as the height of the button above the level of the axis. The time is counted from the pass through the middle going up, so the sine model is used.
Formula
$x = A \sin(2\pi f t)$, where $A = r$, that is, $x = r \sin(2\pi f t)$
Conversions
$f$$= 45\,\tfrac{1}{\text{min}}$$= \dfrac{45}{60\,\text{s}}$$= 0.75\,\text{Hz}$Substitution
$x$$= 15\,\text{cm} \cdot \sin(2\pi \cdot 0.75\,\text{Hz} \cdot 0.20\,\text{s})$$= 15\,\text{cm} \cdot \sin 0.9425$$= 15\,\text{cm} \cdot 0.8090$$= 12.14\,\text{cm}$Answer
$12\,\text{cm}$
Above the middle, two significant figures as in the distance $15\,\text{cm}$ and the rate $45\,\tfrac{1}{\text{min}}$.
Reasonableness
The period is $\tfrac{1}{0.75\,\text{Hz}} = 1.33\,\text{s}$, so the shadow is at its highest at $\tfrac{T}{4} = 0.33\,\text{s}$. At $0.20\,\text{s}$ it is still rising, so the displacement must be a little less than $15\,\text{cm}$, like $12\,\text{cm}$. The disc has turned $0.15$ of a revolution, that is, $54^\circ$, and $\sin 54^\circ = 0.81$.
- Exercise 7-12
Two weights oscillate side by side on different springs. The period of the first is $0.60\,\text{s}$ and that of the second $0.90\,\text{s}$. Both pass the equilibrium position going up at the same moment.
How soon after that do they next pass the equilibrium position going up at the same time? The oscillation does not die out.
Answer
$1.8\,\text{s}$
Show the solution
Given
periods $T_1 = 0.60\,\text{s}$ and $T_2 = 0.90\,\text{s}$, both pass the equilibrium position going up at the time $0$
Find
the shortest time $t$ after which they again pass the equilibrium position going up at the same time
Principle
The first weight passes the equilibrium position going up at intervals of a full period, at the times $0.60\,\text{s}$, $1.20\,\text{s}$, $1.80\,\text{s}$, … and the second at the times $0.90\,\text{s}$, $1.80\,\text{s}$, … We look for the shortest time that is a whole multiple of both periods: integers $k$ and $m$ for which $k T_1 = m T_2$.
Formula
$k T_1 = m T_2$, from which $\dfrac{k}{m} = \dfrac{T_2}{T_1}$, and $t = k T_1$ with the smallest integer $k$
Conversions
None needed: both periods are in seconds.
Substitution
$\dfrac{k}{m}$$= \dfrac{0.90\,\text{s}}{0.60\,\text{s}}$$= 1.5$$= \dfrac{3}{2}$so
$k$$= 3$$t$$= 3 \cdot 0.60\,\text{s}$$= 1.80\,\text{s}$Answer
$1.8\,\text{s}$
Two significant figures as in the periods $0.60\,\text{s}$ and $0.90\,\text{s}$.
Reasonableness
In the time $1.8\,\text{s}$ the first makes $\tfrac{1.8}{0.60} = 3$ and the second $\tfrac{1.8}{0.90} = 2$ full oscillations, so both are again in the starting state. It does not happen earlier: at $0.90\,\text{s}$ the first has made only one and a half oscillations and passes the equilibrium position going down.
