
Your own experimental investigation: planning, carrying out and reporting
Why do two groups get different speeds for the same toy car, even though both measure carefully?
Prior knowledge
- A measurement result has an uncertainty, and repeating the measurement gives a meanchapter Measuring and the reliability of a measurement
- A straight line is fitted to the data points, and its slope tells the rate of changechapter Graphing and fitting a straight line
Core path: follow the steps in order. Tasks marked Optional give extra practice. Optional tasks: 5.
Think about it
Two groups measure the speed of the same toy car with a hand stopwatch. Group A runs the car once over a distance of $0.50\,\text{m}$, gets a time of $1.0\,\text{s}$ and calculates a speed of $0.50\,\text{m/s}$. Group B runs five different distances, three times each. Over $2.00\,\text{m}$ the mean time is $4.73\,\text{s}$, and group B calculates a speed of $0.42\,\text{m/s}$. The car and the batteries are the same.
Why do the results differ, and how should an investigation be designed so that its result can be trusted?
Optional Review: repeats and uncertainty
Predict
Make your predictions before investigating 1 question
Prediction: why the results differ
Investigate
Lab record of group B
Simulated example data
Group B ran the car over five distances and measured three times with a hand stopwatch for each. The table shows the mean of the times $\bar{t}$, half of the range $\Delta t$, the relative uncertainty $\varepsilon = \Delta t : \bar{t}$ and the speed $v = s : \bar{t}$.
| $s\ (\text{m})$ | $t_1\ (\text{s})$ | $t_2\ (\text{s})$ | $t_3\ (\text{s})$ | $\bar{t}\ (\text{s})$ | $\Delta t\ (\text{s})$ | $\varepsilon$ | $v\ (\text{m/s})$ |
|---|---|---|---|---|---|---|---|
| 0.50 | 1.3 | 1.1 | 1.4 | 1.27 | 0.15 | $12\,\%$ | 0.39 |
| 1.00 | 2.5 | 2.3 | 2.6 | 2.47 | 0.15 | $6.1\,\%$ | 0.41 |
| 1.50 | 3.7 | 3.5 | 3.6 | 3.60 | 0.10 | $2.8\,\%$ | 0.42 |
| 2.00 | 4.9 | 4.6 | 4.7 | 4.73 | 0.15 | $3.2\,\%$ | 0.42 |
| 2.50 | 5.8 | 6.1 | 5.9 | 5.93 | 0.15 | $2.5\,\%$ | 0.42 |
Distance as a function of time
Simulated example data
The graph shows the mean times and distances of group B. The horizontal bars of the points are the time uncertainties $\Delta t$. The clock is started when the car passes the start line, so at the time $t = 0$ the distance is $s = 0$, and a straight line through the origin has been fitted to the points (chapter Graphing and fitting a straight line). The distance is on the vertical axis although it was the variable that was changed: the slope $\Delta s : \Delta t$ requires time to be on the horizontal axis.
The line passes through the origin and the point $(5.0\,\text{s}$; $2.1\,\text{m})$.
What is the speed of the car, that is, the slope of the line? Give the answer in m/s.
Hint 1: a guiding question
What does the slope of the graph tell you when time is on the horizontal axis and distance on the vertical axis?
Hint 2: what is the connection
The slope is the ratio of the vertical change to the horizontal change: $v = \dfrac{\Delta s}{\Delta t}$.
Hint 3: an intermediate step
The line passes through the origin, so $\Delta s = 2.1\,\text{m} - 0\,\text{m}$ and $\Delta t = 5.0\,\text{s} - 0\,\text{s}$.
Show the solution
Given
a point on the line $(t, s) = (5.0\,\text{s}$; $2.1\,\text{m})$, and the line passes through the origin $(0, 0)$
Find
the speed $v$ of the car in $\text{m/s}$
Principle
The car moves uniformly and the clock is started when the car passes the start line, so at the time $t = 0$ the distance is $s = 0$: the distance is directly proportional to time, $s = vt$, and the line of the $(t, s)$ graph passes through the origin. The slope of the line is the speed.
Reading the graph
Read a point from the line whose coordinates are known accurately: when $t = 5.0\,\text{s}$, the line is at the height $s = 2.1\,\text{m}$. The other point is the origin. The slope is calculated between these points.
Formula
Conversions
The distance is in metres and the time in seconds, so no conversions are needed.
Substitution
Answer
$0.42\,\text{m/s}$
Two significant figures, because the distance $2.1\,\text{m}$ read from the graph can be read to two figures.
Reasonableness
The result agrees with the speeds $0.42\,\text{m/s}$ in the table for the longer distances. The last point of the graph gives $2.50\,\text{m} : 5.93\,\text{s} = 0.42\,\text{m/s}$, so the line describes the points well.
A fair experiment?
Theory summary
Key idea
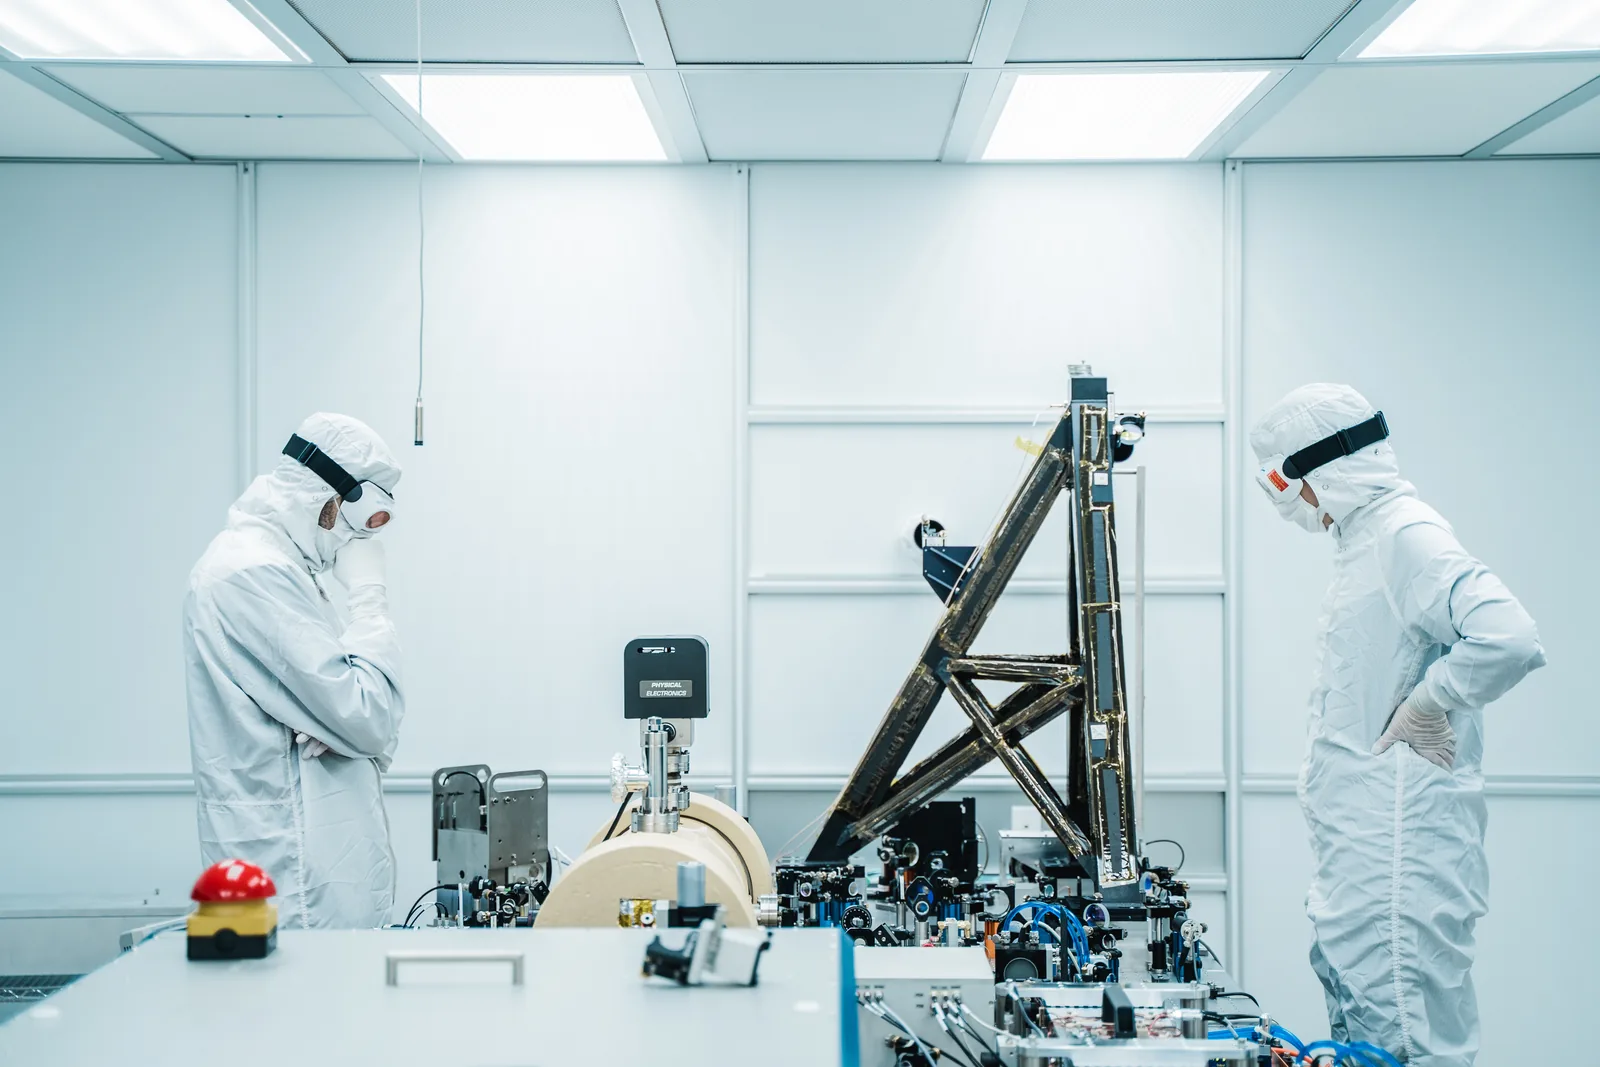
Physics is an experimental science: a claim holds only once it has been tested with measurements that anyone can repeat. An investigation is a systematic way of answering a question by measuring. It begins with a question and ends with a conclusion that the measurement results support. A good investigation is not one where the assumption turns out to be right, but one where the measurement could have shown the assumption to be wrong.
Research question and hypothesis
A research question is a question that a measurement can answer: "How does the distance travelled by a toy car depend on time?" The question "Which car is best?" is no good, because it cannot be measured.
A hypothesis is a reasoned, testable prediction that answers the question. For example: "If the car moves at constant speed, the distance travelled is directly proportional to time, $s = vt$." A hypothesis must lead to something measurable that could turn out to be wrong. The prediction "the car goes somehow" is not a hypothesis, because no measurement can disprove it.
Variables
A variable is a quantity whose value can vary in an investigation. In an experiment you change one variable, measure another and keep everything else the same:
- independent variable: the experimenter chooses its values, here the distance $s$
- dependent variable: its value is read from an instrument, here the time $t$
- controlled variables: stay the same throughout the experiment, here the car, the batteries, the surface and the way of starting.
If two variables change at the same time, for example the distance and the batteries, you cannot tell what caused the change in the result. That is why an experiment is fair only when just the independent variable changes.
Planning before measuring
Before measuring, the plan answers these questions: what is measured and with which instrument, which values are chosen for the independent variable and how many, how many repeats are made for each value, and what is kept constant. Try it out first with a trial run. It tells you whether the measurement is possible at all, and it gives a rough estimate of the result.
Choose the measuring range so that the quantity being measured is clearly larger than the uncertainty of the measurement (see the section Relative uncertainty and choosing the measuring range). Choose several values at equal intervals, because one or two points do not show whether the dependence is a straight line.
Lab record
A lab record is a log made during the experiment, not from memory afterwards. It contains the research question, the date, the equipment and its accuracy, the controlled variables, the measurements as a table with units, and observations, for example "the car veered sideways".
Record the readings as they are. Do not quietly delete or correct a measurement that looks odd: mark it and write down what happened. A short example:
| $s\ (\text{m})$ | $t_1\ (\text{s})$ | $t_2\ (\text{s})$ | $t_3\ (\text{s})$ | note |
|---|---|---|---|---|
| 0.50 | 1.3 | 1.1 | 1.4 | hard to time |
| 1.00 | 2.5 | 2.3 | 2.6 | |
| 1.50 | 3.7 | 3.5 | 3.6 |
Report
A report describes the investigation so that someone else can repeat it and judge the conclusion. Its parts are:
- research question and hypothesis
- method: equipment, variables and procedure
- results: table, graph and the value of the quantity with its uncertainty
- discussion: sources of error and what you would do differently next time
- conclusion: the answer to the research question and whether the results support the hypothesis.
A conclusion is only as strong as the data. If the measurements agree with the prediction within the uncertainty, the hypothesis has gained support, but it has not been proved.
Relative uncertainty and choosing the measuring range
The uncertainty $\Delta t$ of a time measured by hand comes mainly from reaction time, and it is almost the same in a short and a long measurement. The quality of a measurement is therefore described by the relative uncertainty, the uncertainty compared with the measured value. To keep it at most $\varepsilon_\text{max}$, the measured time must be at least
$$\begin{aligned} \varepsilon &= \frac{\Delta t}{t} \\ t &\ge \frac{\Delta t}{\varepsilon_\text{max}} \end{aligned}$$
where $\varepsilon$ is the relative uncertainty (often given as a percentage), $\Delta t$ the uncertainty of the time (s) and $t$ the measured time (s). With an uncertainty $\Delta t = 0.2\,\text{s}$ and a limit of $5\,\%$, the time must be at least $4\,\text{s}$.
The required distance follows from the model of uniform motion $s = vt$. If the measurement is made at several distances, a straight line is fitted to the data points (chapter Graphing and fitting a straight line). When $t$ is on the horizontal axis and $s$ on the vertical axis, the slope of the line is the speed $v$. The shortest valid distance is the one at which the relative uncertainty just stays within the chosen limit $\varepsilon_\text{max}$. On a shorter distance the relative uncertainty exceeds this limit, and the result is too imprecise.
Common misconception
Many people think an investigation has failed if the measurement does not support the hypothesis. This is not so: if a measurement disproves the hypothesis, the investigator knows something they did not know before. A failed investigation is one from which nothing can be concluded, because the variables were not controlled or the measurements are too uncertain.
Another common mistake is to treat one measurement as enough. A single reading does not show how much the result varies, so the spread caused by random error cannot be estimated. A third mistake is to pick the measurements that fit the result and leave out the others: all measurements are recorded, and an outlier is explained or marked.
Summary
- An investigation begins with a question that can be measured and a testable hypothesis that could turn out to be wrong.
- In a fair experiment you change one variable, measure another and keep the others constant.
- The measurement is planned in advance: measuring range, number of points, repeats and controlled variables. A trial run checks the plan.
- The lab record contains the readings, units, equipment and observations, written during the experiment. No measurement is quietly deleted.
- The relative uncertainty $\varepsilon = \Delta t : t$ gets smaller as the measured time gets longer; therefore the time must be at least $\Delta t : \varepsilon_\text{max}$.
- A report gives the question, method, results, discussion and conclusion so that someone else can repeat the investigation.
Optional Return to your prediction
Compare your prediction with the lab record of group B and the formula for relative uncertainty. Then return to the opening question: why do the results of group A and group B differ, and how should an investigation be designed so that its result can be trusted?
Would you change your prediction?
Apply
Worked example
Problem
Students investigate the motion of a toy car. In a trial run the speed of the car is about $0.42\,\text{m/s}$. The time is measured with a hand stopwatch, and the timing uncertainty is $\Delta t = 0.2\,\text{s}$. The relative uncertainty of the measurement should be at most $5.0\,\%$. What is the shortest distance the car must travel?
Step 1/7
Given and unknown. Speed $v = 0.42\,\text{m/s}$, uncertainty of the time $\Delta t = 0.2\,\text{s}$ and largest allowed relative uncertainty $\varepsilon_\text{max} = 5.0\,\% = 0.050$. We are asked for the shortest distance $s_\text{min}$.
Step 2/7
Principle. The relative uncertainty gets smaller as the measured time gets longer, because $\Delta t$ stays the same. First calculate the shortest allowed time from the uncertainty limit. The car moves at constant speed, so the model of uniform motion $s = vt$ gives the distance from the time.
Step 3/7
Rearranged formula. $$\begin{aligned} t_\text{min} &= \frac{\Delta t}{\varepsilon_\text{max}} \\ s_\text{min} &= v\, t_\text{min} = \frac{v\,\Delta t}{\varepsilon_\text{max}} \end{aligned}$$
Step 4/7
Unit conversions. Not needed: the speed is in $\text{m/s}$ and the time in seconds, so the distance comes out in metres. The percentage has been converted to a decimal number: $5.0\,\% = 0.050$.
Step 5/7
Substitution. $$\begin{aligned} t_\text{min} &= \frac{\Delta t}{\varepsilon_\text{max}} \\ &= \frac{0.2\,\text{s}}{0.050} = 4\,\text{s} \\ s_\text{min} &= v\, t_\text{min} \\ &= 0.42\,\tfrac{\text{m}}{\text{s}} \cdot 4\,\text{s} \\ &= 1.68\,\text{m} \end{aligned}$$
Step 6/7
Result. The distance must be at least $1.7\,\text{m}$. The result is rounded to two significant figures like the speed $0.42\,\text{m/s}$; the uncertainty $0.2\,\text{s}$ is given with one figure, and it gives only an estimate of the shortest time.
Step 7/7
Reasonableness. Over $1.7\,\text{m}$ the travel time of the car is about $1.7\,\text{m} : 0.42\,\text{m/s} \approx 4.05\,\text{s}$, so
which is just within the limit. Over $0.50\,\text{m}$ the time would be only $1.2\,\text{s}$ and the uncertainty about $17\,\%$, which is why the short distance was a poor choice.
Optional Find the error
Optional Apply to a new situation
Students measure walking speed, about $1.4\,\text{m/s}$, with a hand stopwatch. The uncertainty of the time is $0.3\,\text{s}$, and the relative uncertainty must be at most $3.0\,\%$.
What is the shortest valid measuring distance? Give the answer in metres.
Hint 1: a guiding question
What length of time makes the relative uncertainty $3.0\,\%$ when the uncertainty is $0.3\,\text{s}$?
Hint 2: what is the connection
The shortest time is
and the percentage must be substituted as a decimal number. The distance comes from the model $s = vt$.
Hint 3: an intermediate step
and $s = 1.4\,\text{m/s} \cdot 10\,\text{s}$.
Show the solution
Given
speed $v = 1.4\,\text{m/s}$, uncertainty of the time $\Delta t = 0.3\,\text{s}$, limit of the relative uncertainty $\varepsilon_\text{max} = 3.0\,\% = 0.030$
Find
the shortest valid measuring distance $s_\text{min}$ in metres
Principle
The uncertainty of timing by hand is the same in a long and a short measurement, so the relative uncertainty gets smaller as the time gets longer. Walking is approximately uniform motion, so the distance comes from the model $s = vt$.
Formula
Conversions
The percentage is converted to a decimal number: $3.0\,\% = 0.030$. No other conversions are needed, because the time is in seconds and the speed in $\text{m/s}$.
Substitution
Answer
$14\,\text{m}$
Two significant figures like the speed and the limit.
Reasonableness
Ten seconds is 33 times the uncertainty $0.3\,\text{s}$, so the fraction is about $\tfrac{1}{33} \approx 3.0\,\%$. Fourteen metres fits in a school corridor or yard, so the experiment is feasible.
Plan your own investigation
Choose a phenomenon that you can investigate at school or at home and in which the quantities can be measured: for example the speed of walking or of a rolling ball, the cooling of water in a cup, or the stretching of a rubber band. Write a plan: research question, hypothesis, independent, dependent and controlled variables, measuring range and repeats, and how you will keep the lab record.
Model answer
Research question: how does the time a ball takes to roll depend on the distance on a level floor? The ball is always released from the same point over a short starting ramp, and timing starts when the ball passes a start line marked on the floor, by which point its speed has levelled off. Hypothesis: if the speed of the ball on the floor is approximately constant, the travel time is directly proportional to the distance, $s = vt$. If the time grows faster than the distance, the hypothesis is wrong. The independent variable is the distance from the start line (for example $1.6$–$3.2\,\text{m}$ at five equally spaced values), the dependent variable is the time with a hand stopwatch, and I keep constant the ball, the height of the ramp and the starting point, the surface and the way of starting (the ball is released without a push). In a trial run the speed of the ball is about $0.4\,\text{m/s}$. A real ball slows down slightly while rolling because of rolling resistance, so the experiment also tests whether the speed is constant enough. The uncertainty of timing by hand is about $0.2\,\text{s}$, so over the shortest distance the time must be at least $4\,\text{s}$ for the relative uncertainty to stay at most $5\,\%$. The distance $1.6\,\text{m}$ gives a time of $4\,\text{s}$. I make three repeats for each distance and write every reading with its unit in the lab record, together with observations such as "the ball hit the wall". The trial run shows whether the distance is long enough.
Assess your own answer
Tick the points your own answer already contains.
Review the theory summary and practise with the exercises.
Carry out your own investigation. Do the experiment according to your plan and keep a lab record on paper or in a spreadsheet during the measurement. Start with a trial run to check the measuring range. Then write a short report with five parts: research question and hypothesis, method, results (table and graph), discussion and conclusion. The exercises on this page are practice; the actual investigation is done with real equipment.
Check your understanding
Exit ticket
Answer on your own first and only then open the answer.
- The uncertainty of the time is $0.2\,\text{s}$. How long a time must be measured at least for the relative uncertainty to be at most $2.0\,\%$?
Answer
$t$$\ge \dfrac{\Delta t}{\varepsilon_\text{max}}$$= \dfrac{0.2\,\text{s}}{0.020}$$= 10\,\text{s}$ - What goes in a lab record, and why is a measurement that looks unusual not quietly deleted?
Answer
The lab record contains the research question, the date, the equipment and its accuracy, the controlled variables, the readings with their units, and observations. A clearly deviating measurement is checked, marked and explained, and it can be repeated if necessary. A result is not deleted just because it differs from the others, because then the result would be chosen to fit the expectation and the investigation would no longer test the hypothesis. Any rejection must be justified and documented.
1. Concept
2. Variables
3. Calculating uncertainty
A student measures a walking time five times: $9.8\,\text{s}$, $10.2\,\text{s}$, $10.0\,\text{s}$, $9.9\,\text{s}$ and $10.1\,\text{s}$. In this exercise the uncertainty is estimated simply and cautiously as half of the range.
What is the relative uncertainty of the result as a percentage, when this estimate is used as the uncertainty?
Hint 1: a guiding question
What is the mean, and what are the largest and smallest readings?
Hint 2: what is the connection
The uncertainty is
and the relative uncertainty
Hint 3: an intermediate step
Show the solution
Given
five times $9.8\,\text{s}$, $10.2\,\text{s}$, $10.0\,\text{s}$, $9.9\,\text{s}$ and $10.1\,\text{s}$
Find
the relative uncertainty $\varepsilon$ of the result as a percentage, when the uncertainty is half of the range
Principle
The repeats give a mean. The spread of the readings is estimated here simply as half of the range, and this is used as the estimate of the uncertainty. The relative uncertainty is the uncertainty divided by the mean.
Formula
Conversions
All times are in seconds, so no conversions are needed. The quotient is multiplied by one hundred to get a percentage.
Substitution
the sum of the times is $50.0\,\text{s}$, so
so
Answer
$2\,\%$
One significant figure like the uncertainty $0.2\,\text{s}$ (calculator value $2.0\,\%$).
Reasonableness
Ten seconds is 50 times the uncertainty $0.2\,\text{s}$, so the fraction is about $\tfrac{1}{50} = 2\,\%$. All readings are within $0.2\,\text{s}$ of the mean, because the estimate describes the spread of the individual readings. The uncertainty of the mean itself is usually smaller than this, so the estimate is cautious.
Suggestion: one answer does not show everything you can do, but review the theory summary and do the core exercises.
Optional 4. Explain the conclusion
The conclusion of a student's report reads: "The hypothesis was proved correct, because the measurement gave the speed $0.42\,\text{m/s}$ as predicted." Explain what is too strong in the claim and how the conclusion should be worded.
Model answer
One experiment cannot prove a hypothesis correct. It can give it support if the result agrees with the prediction within the uncertainty, or refute it. A conclusion must contain the result with its uncertainty, for example $v = 0.42 \pm 0.02\,\text{m/s}$, and it must be compared with the prediction: the result fits the prediction, so the measurement supports the hypothesis. It must also say under what conditions the result was obtained, for example with a particular car and surface, and what was left uninvestigated, such as longer distances. This lets someone else judge how far the conclusion can be trusted.
Assess your own answer
Tick the points your own answer already contains.
Review the theory summary and practise with the exercises.
Review the chapter's concepts
Cards you mark Review later collect in your review deck.
- Research question
- A precise question that an investigation aims to answer.
- Experimental plan
- A description, written in advance, of the measurements, the equipment and how the investigation is carried out.
- Series of measurements
- A set of measurement results collected systematically from the same phenomenon.
- Repeatability
- A well-described experiment can be done again with similar results.
- Data
- The values, observations, pictures or videos collected in an experiment for analysis.
- Analysis of results
- Processing the data with calculations and graphs to find relationships.
- Conclusion
- A justified answer to the research question drawn from the results.
- Source of error
- A factor that can cause a deviation or uncertainty in a measurement result.
- Reliability
- An assessment of how well the method and the results support the conclusion.
- Report
- A written account of the research question, method, results, conclusions and evaluation.
- Finding information
- Searching for reliable information, for example in research, textbooks, databases and expert sources.
- Source of information
- The background and purpose of whoever publishes information affect how it should be assessed.
- Source criticism
- Assessing the reliability of a source by its author, reasoning, currency and other sources.
- Material
- A text, picture, table, graph or other source of information from which conclusions are drawn.
- Objectivity
- The aim of describing observations independently of the researcher's personal opinions.
Exercises
Level 1 · basic practice 8 exercises
One formula or one step of reasoning. Core exercises first, the rest is extra practice.
- Exercise 8-1Core
A ball rolls down a slope, and a student measures its travel time with a hand stopwatch as $4.0\,\text{s}$. The timing uncertainty is $\Delta t = 0.2\,\text{s}$.
What is the relative uncertainty $\varepsilon$ of the time as a percentage?
Answer
$5\,\%$
Show the solution
Given
measured time $t = 4.0\,\text{s}$, timing uncertainty $\Delta t = 0.2\,\text{s}$
Find
the relative uncertainty $\varepsilon$ of the time as a percentage
Principle
The relative uncertainty tells what fraction of the measurement result is uncertainty. You get it by dividing the uncertainty by the measured value.
Formula
$\varepsilon = \dfrac{\Delta t}{t}$
Conversions
Both $\Delta t$ and $t$ are in seconds, so the units cancel. The quotient is multiplied by one hundred to get a percentage.
Substitution
$\varepsilon$$= \dfrac{0.2\,\text{s}}{4.0\,\text{s}}$$= 0.050$$= 5.0\,\%$Answer
$5\,\%$
One significant figure like the uncertainty $0.2\,\text{s}$ (calculator value $5.0\,\%$).
Reasonableness
Four seconds is 20 times the uncertainty $0.2\,\text{s}$, so the uncertainty is about $\tfrac{1}{20} = 5\,\%$ of the measured time.
- Exercise 8-2Core
A student walks a distance of ten metres five times and measures the times $12.3\,\text{s}$, $12.5\,\text{s}$, $12.2\,\text{s}$, $12.6\,\text{s}$ and $12.4\,\text{s}$. What is the mean of the measurements?
Answer
$12.4\,\text{s}$
Show the solution
Given
five measurements $12.3\,\text{s}$, $12.5\,\text{s}$, $12.2\,\text{s}$, $12.6\,\text{s}$ and $12.4\,\text{s}$
Find
the mean $\bar{t}$ of the measurements in seconds
Principle
Random timing errors are sometimes too high and sometimes too low. When the measurement is repeated, the errors partly cancel, so the mean is a better estimate than a single measurement.
Formula
$\bar{t}$$= \dfrac{t_1 + t_2 + t_3 + t_4 + t_5}{5}$Conversions
All times are already in seconds, so no conversions are needed.
Substitution
the sum of the times is $62.0\,\text{s}$, so
$\bar{t}$$= \dfrac{62.0\,\text{s}}{5}$$= 12.4\,\text{s}$Answer
$12.4\,\text{s}$
Three significant figures like the measurements.
Reasonableness
The mean lies between the smallest measurement $12.2\,\text{s}$ and the largest $12.6\,\text{s}$, as a mean must. It is also at the middle measurement $12.4\,\text{s}$, because the deviations are fairly symmetrical.
- Exercise 8-3
The marked driving distance of a toy car is $1.50\,\text{m}$, and the car covers it in $3.6\,\text{s}$.
What is the speed of the car? Assume the speed is constant and answer in m/s.
Answer
$0.42\,\text{m/s}$
Show the solution
Given
distance $s = 1.50\,\text{m}$, time $t = 3.6\,\text{s}$
Find
the speed $v$ of the car in $\text{m/s}$
Principle
The car moves at constant speed, so the distance is directly proportional to time: $s = vt$. The speed is the ratio of distance to time.
Formula
$s = vt$, so $v = \dfrac{s}{t}$
Conversions
The distance is in metres and the time in seconds, so the result comes out directly in $\text{m/s}$.
Substitution
$v$$= \dfrac{1.50\,\text{m}}{3.6\,\text{s}}$$= 0.4167\,\text{m/s}$Answer
$0.42\,\text{m/s}$
Two significant figures like the time $3.6\,\text{s}$.
Reasonableness
The result is of the order of an ordinary toy car, less than a third of walking pace ($1.4\,\text{m/s}$). Rough check: $0.4\,\text{m/s} \cdot 3.6\,\text{s} \approx 1.4\,\text{m}$, which is close to 1.5 metres.
- Exercise 8-4
The length of a table is measured five times with a ruler: $24.1\,\text{cm}$, $24.4\,\text{cm}$, $24.0\,\text{cm}$, $24.3\,\text{cm}$ and $24.2\,\text{cm}$. The uncertainty is estimated as half of the range of the measurements.
How large is the uncertainty?
Answer
$0.2\,\text{cm}$
Show the solution
Given
five measurements $24.1\,\text{cm}$, $24.4\,\text{cm}$, $24.0\,\text{cm}$, $24.3\,\text{cm}$ and $24.2\,\text{cm}$
Find
the uncertainty $\Delta x$ in centimetres
Principle
Here the uncertainty is estimated simply as half of the range: it describes the spread of the repeated measurements around the mean. Repeats do not reveal a systematic error.
Formula
$\Delta x$$= \dfrac{x_\text{max} - x_\text{min}}{2}$Conversions
All lengths are in centimetres, so no conversions are needed.
Substitution
$\Delta x$$= \dfrac{24.4\,\text{cm} - 24.0\,\text{cm}}{2}$$= \dfrac{0.4\,\text{cm}}{2}$$= 0.2\,\text{cm}$Answer
$0.2\,\text{cm}$
One significant figure, because the uncertainty is given with one figure.
Reasonableness
The uncertainty is two millimetres, which suits a measurement made with a ruler whose smallest scale division is a millimetre. The largest deviation of the measurements from the mean $24.2\,\text{cm}$ is $0.2\,\text{cm}$.
- Exercise 8-5
In a row of a lab record the distance is $2.00\,\text{m}$, the mean of three times is $4.73\,\text{s}$ and half of the range is $\Delta t = 0.15\,\text{s}$.
What is the relative uncertainty $\varepsilon$ of the time as a percentage?
Answer
$3.2\,\%$
Show the solution
Given
on the row of the lab record, distance $s = 2.00\,\text{m}$, mean of the times $\bar{t} = 4.73\,\text{s}$ and half of the range $\Delta t = 0.15\,\text{s}$
Find
the relative uncertainty $\varepsilon$ of the time as a percentage
Principle
The relative uncertainty tells what fraction of the measured time the uncertainty is. You get it by dividing the uncertainty written in the lab record by the mean time; the distance is not needed.
Formula
$\varepsilon$$= \dfrac{\Delta t}{\bar{t}}$Conversions
Both times are in seconds, so no conversions are needed. The quotient is multiplied by one hundred to get a percentage.
Substitution
$\varepsilon$$= \dfrac{0.15\,\text{s}}{4.73\,\text{s}}$$= 0.0317$$= 3.2\,\%$Answer
$3.2\,\%$
Two significant figures like the uncertainty $0.15\,\text{s}$.
Reasonableness
Rough estimate: $0.15 : 4.7$ is about $0.03$, that is, about $3\,\%$. The result agrees with the value $3.2\,\%$ in the table of the lab record and is below $5\,\%$, so the distance $2.00\,\text{m}$ is enough.
- Exercise 8-6
A student investigates how the temperature of water affects how long a sugar cube takes to dissolve. He dissolves sugar cubes of the same size in the same amount of water at different temperatures and measures the dissolving time.
What is the independent (manipulated) variable of the investigation?
Answer
The temperature of the water
Show the solution
Find
the independent (manipulated) variable of the investigation.
Principle
The independent variable is the one the investigator changes on purpose. The dependent variable is the one that is measured and expected to change. The controlled variables are kept the same in all measurements, so that the change can be linked to the independent variable.
Model answer
The independent variable is the temperature of the water, because the student chooses it himself. The dependent variable is the dissolving time of the sugar cube, which he measures. The amount of water and the size of the sugar cube are controlled, that is, they are kept the same. The clock is a measuring instrument and not a variable of the investigation.
- Exercise 8-7
Students want to investigate a pendulum in a school physics lesson with a simple experiment. Which of the following is a good research question?
Answer
How does the length of the pendulum string affect the length of the period?
Show the solution
Find
which of the questions presented is a good research question.
Principle
A good research question is precise and can be answered by measuring. It names one variable that is changed and one quantity that is measured, and the experiment can be done with the equipment available.
Model answer
A good question is “How does the length of the pendulum string affect the length of the period?” The length of the string can be changed, the period can be measured, and the other factors can be kept the same. The questions “What is a pendulum like?” and “Why does a pendulum swing at all?” are too vague or too broad for one experiment. The question “Is a pendulum nice?” does not concern a measurable quantity.
- Exercise 8-8
The writer of a lab report is thinking about which section each sentence belongs to.
Which of the following sentences belongs in the results section of the report and not in the discussion?
Answer
The mean of the five measurements was $12.4\,\text{s}$ and half of the range was $0.2\,\text{s}$.
Show the solution
Find
which sentence belongs in the results section and not in the discussion.
Principle
The results section tells what was measured and calculated: tables, graphs, means and uncertainties. The discussion interprets the results: it evaluates sources of error and reliability, takes a stand on the hypothesis and suggests further research.
Model answer
The sentence “The mean of the five measurements was $12.4\,\text{s}$ and half of the range was $0.2\,\text{s}$.” belongs in the results, because it states calculated values without interpretation. The evaluation of a source of error (reaction time), the stand on the hypothesis and the suggestion for improvement (photogate) are interpretation, so they belong in the discussion.
Level 2 · applied practice 7 exercises
Two steps, working with measured data, a unit conversion or rearranging a formula. Core exercises first, the rest is extra practice.
- Exercise 8-9Core
The travel time of a toy car is measured five times, and the results are $7.8\,\text{s}$, $8.2\,\text{s}$, $7.9\,\text{s}$, $8.1\,\text{s}$ and $8.0\,\text{s}$. Half of the range is taken as a simple and cautious estimate of the uncertainty.
What is the relative uncertainty of the result as a percentage?
Answer
$2.5\,\%$
Show the solution
Given
five times $7.8\,\text{s}$, $8.2\,\text{s}$, $7.9\,\text{s}$, $8.1\,\text{s}$ and $8.0\,\text{s}$
Find
the relative uncertainty $\varepsilon$ of the result as a percentage, when the uncertainty is half of the range
Principle
First calculate the mean and a simple estimate of the uncertainty, half of the range. The relative uncertainty is the uncertainty divided by the mean, so it tells the quality of the measurement regardless of the unit.
Formula
$\bar{t}$$= \dfrac{\sum t_i}{5}$$\Delta t$$= \dfrac{t_\text{max} - t_\text{min}}{2}$$\varepsilon$$= \dfrac{\Delta t}{\bar{t}}$Conversions
All times are in seconds, so no conversions are needed. The quotient is multiplied by one hundred to get a percentage.
Substitution
$\bar{t}$$= \dfrac{40.0\,\text{s}}{5}$$= 8.0\,\text{s}$$\Delta t$$= \dfrac{8.2\,\text{s} - 7.8\,\text{s}}{2}$$= 0.2\,\text{s}$so
$\varepsilon$$= \dfrac{0.2\,\text{s}}{8.0\,\text{s}}$$= 0.025$$= 2.5\,\%$Answer
$2.5\,\%$
(calculator value). The uncertainty $0.2\,\text{s}$ is a rough estimate with one figure, so in a report it is enough to round the relative uncertainty to one significant figure, about $3\,\%$. The answer field accepts both.
Reasonableness
Eight seconds is 40 times the uncertainty $0.2\,\text{s}$, so the fraction is about $\tfrac{1}{40} = 2.5\,\%$. It is smaller than the $5.0\,\%$ of the $4.0\,\text{s}$ measurement, as it should be for a longer time.
- Exercise 8-10Core
A car covers a distance of $3.0\,\text{m}$ at a constant speed of $1.5\,\text{m/s}$. The travel time is measured with a hand stopwatch, and the timing uncertainty is $0.20\,\text{s}$.
What is the relative uncertainty of the measured time as a percentage?
Answer
$10\,\%$
Show the solution
Given
speed $v = 1.5\,\text{m/s}$, distance $s = 3.0\,\text{m}$, timing uncertainty $\Delta t = 0.20\,\text{s}$
Find
the relative uncertainty $\varepsilon$ of the time as a percentage
Principle
The car moves at constant speed, so the travel time follows from the model of uniform motion $s = vt$. After that the relative uncertainty is the uncertainty divided by the time.
Formula
$t$$= \dfrac{s}{v}$$\varepsilon$$= \dfrac{\Delta t}{t}$$= \dfrac{\Delta t\, v}{s}$Conversions
The distance is in metres and the speed in $\text{m/s}$, so the time comes out in seconds. The quotient is multiplied by one hundred to get a percentage.
Substitution
$t$$= \dfrac{3.0\,\text{m}}{1.5\,\text{m/s}}$$= 2.0\,\text{s}$so
$\varepsilon$$= \dfrac{0.20\,\text{s}}{2.0\,\text{s}}$$= 0.10$$= 10\,\%$Answer
$10\,\%$
Two significant figures like the distance and the speed.
Reasonableness
In a two-second measurement, a reaction-time error of $0.20\,\text{s}$ is a tenth of the total time. The result is twice the $5\,\%$ that a long measurement would reach, which is why the short distance is a poor choice.
- Exercise 8-11
In a lab record the position of a car is $90\,\text{cm}$ when $2.0\,\text{s}$ has passed, and $342\,\text{cm}$ when $8.0\,\text{s}$ has passed. Assume the motion is uniform.
What is the speed of the car? Answer in m/s.
Answer
$0.42\,\text{m/s}$
Show the solution
Given
points $(t_1, s_1) = (2.0\,\text{s}, 90\,\text{cm})$ and $(t_2, s_2) = (8.0\,\text{s}, 342\,\text{cm})$
Find
the speed $v$ in $\text{m/s}$
Principle
The motion is uniform, so the distance changes steadily with time, and the speed is the ratio of the change in distance to the change in time, that is, the slope between two points.
Formula
$v$$= \dfrac{\Delta s}{\Delta t}$$= \dfrac{s_2 - s_1}{t_2 - t_1}$Conversions
Convert the distances to metres: $90\,\text{cm} = 0.90\,\text{m}$ and $342\,\text{cm} = 3.42\,\text{m}$.
Substitution
$v$$= \dfrac{3.42\,\text{m} - 0.90\,\text{m}}{8.0\,\text{s} - 2.0\,\text{s}}$$= \dfrac{2.52\,\text{m}}{6.0\,\text{s}}$$= 0.42\,\text{m/s}$Answer
$0.42\,\text{m/s}$
Two significant figures, because the time difference $6.0\,\text{s}$ is given with two figures.
Reasonableness
Between the points $6.0\,\text{s}$ has passed and the distance has grown by just under three metres, so the speed is about $\tfrac{2.5\,\text{m}}{6\,\text{s}} \approx 0.4\,\text{m/s}$. The line crosses the distance axis at
$s_0$$= 0.90\,\text{m} - 0.42\,\text{m/s} \cdot 2.0\,\text{s}$$\approx 0.06\,\text{m}$so it passes almost through the origin.
- Exercise 8-12
According to the hypothesis the speed of the car is $0.50\,\text{m/s}$, but in the experiment the speed is measured as $0.42\,\text{m/s}$.
By how many percent does the measured value differ from the value predicted by the hypothesis?
Answer
$16\,\%$
Show the solution
Given
speed predicted by the hypothesis $v_\text{pred} = 0.50\,\text{m/s}$, measured speed $v_\text{meas} = 0.42\,\text{m/s}$
Find
the deviation of the measured value from the predicted value as a percentage
Principle
A hypothesis is tested by comparing the measurement with its prediction. The deviation is expressed relative to the prediction, so that the difference can be compared with the uncertainty of the measurement regardless of the unit.
Formula
$\delta$$= \dfrac{\left| v_\text{pred} - v_\text{meas} \right|}{v_\text{pred}}$Conversions
Both speeds are in $\text{m/s}$, so the units cancel. The quotient is multiplied by one hundred to get a percentage.
Substitution
$\delta$$= \dfrac{\left| 0.50\,\text{m/s} - 0.42\,\text{m/s} \right|}{0.50\,\text{m/s}}$$= \dfrac{0.08}{0.50}$$= 0.16$$= 16\,\%$Answer
$16\,\%$
Two significant figures like the speeds.
Reasonableness
The measured speed is below the prediction, and the difference $0.08\,\text{m/s}$ is about a sixth of the prediction ($\tfrac{1}{6} \approx 17\,\%$). If the uncertainty of the speed were only a few per cent, the difference would be too large to be chance, and the hypothesis should be rejected or checked.
- Exercise 8-13
A student investigates whether a light ($50\,\text{g}$) and a heavy ($200\,\text{g}$) ball roll down the same slope equally fast. He changes only the mass and measures five travel times for each ball with a hand stopwatch.
He concludes: “The heavy ball is faster, because its mean time is shorter.”
Calculate the mean and the uncertainty (half of the range) of the times of each ball. What percentage of the uncertainty is the difference of the means? Also decide whether the data supports the student's conclusion.
Travel time of the ball on the slope Repeat $t_{50\,\text{g}}\,(\text{s})$ $t_{200\,\text{g}}\,(\text{s})$ 1 3.12 3.06 2 3.08 3.12 3 3.16 3.04 4 3.10 3.10 5 3.14 3.08 Answer
$100\,\%$
Show the solution
Given
times of the light ball $3.12\,\text{s}$, $3.08\,\text{s}$, $3.16\,\text{s}$, $3.10\,\text{s}$ and $3.14\,\text{s}$; times of the heavy ball $3.06\,\text{s}$, $3.12\,\text{s}$, $3.04\,\text{s}$, $3.10\,\text{s}$ and $3.08\,\text{s}$
Find
the difference of the means as a percentage of the uncertainty, and the conclusion on whether the data supports the claim
Principle
When the means of two groups are compared, the difference must be compared with the spread of the measurements. Here half of the range is used as a simple estimate of the spread. If the difference does not exceed the spread and the intervals overlap, the difference cannot be shown.
Formula
$\bar{t}$$= \dfrac{t_1 + \dots + t_5}{5}$$\;\Delta t$$= \dfrac{t_\text{max} - t_\text{min}}{2}$$\;\dfrac{|\bar{t}_{50} - \bar{t}_{200}|}{\Delta t} \cdot 100\,\%$
Conversions
All times are in seconds, so no conversions are needed.
Substitution
The sum of the times of the light ball is $15.60\,\text{s}$, so
$\bar{t}_{50}$$= \dfrac{15.60\,\text{s}}{5}$$= 3.12\,\text{s}$$\Delta t_{50}$$= \dfrac{3.16\,\text{s} - 3.08\,\text{s}}{2}$$= 0.04\,\text{s}$The sum for the heavy ball is $15.40\,\text{s}$, so
$\bar{t}_{200}$$= \dfrac{15.40\,\text{s}}{5}$$= 3.08\,\text{s}$$\Delta t_{200}$$= \dfrac{3.12\,\text{s} - 3.04\,\text{s}}{2}$$= 0.04\,\text{s}$The difference of the means is $3.12\,\text{s} - 3.08\,\text{s} = 0.04\,\text{s}$, so
$\dfrac{0.04\,\text{s}}{0.04\,\text{s}} \cdot 100\,\%$$= 100\,\%$Answer
$100\,\%$
The difference of the means is as large as the uncertainty. The intervals $3.12\,\text{s} \pm 0.04\,\text{s}$, that is $3.08$–$3.16\,\text{s}$, and $3.08\,\text{s} \pm 0.04\,\text{s}$, that is $3.04$–$3.12\,\text{s}$, overlap, so the data does not support the claim “the heavy ball is faster”.
Reasonableness
The times of the light ball vary between $3.08$ and $3.16\,\text{s}$ and those of the heavy ball between $3.04$ and $3.12\,\text{s}$, and both balls have times in the interval $3.08$–$3.12\,\text{s}$. So the difference is not greater than the variation within one ball. This does not prove that mass has no effect: the difference simply cannot be shown in these measurements. More repeats and more accurate timing could show whether there is a difference.
- Exercise 8-14
A student investigates whether the mass of a cart affects how fast the cart rolls down a ramp.
His plan is: “I let a light cart roll down a gentle ramp and a heavy cart down a steep ramp and compare the times.” Which change fixes the plan?
Answer
Use the same ramp angle for both carts and change only the mass of the cart.
Show the solution
Find
which change fixes the plan.
Principle
For the difference in times to be linked to the mass, only the mass may change. The other factors, such as the ramp angle, are kept constant. When two variables change at the same time, the difference may be caused by either.
Model answer
The plan is fixed by using the same ramp angle for both carts and changing only the mass of the cart. In the original plan the mass and the angle change at the same time, so the difference in time does not tell which of them caused it. Repeats and a more accurate clock reduce random error and the uncertainty of the measurement, but they do not remove this flaw in the design. An even heavier cart and a steeper ramp would make it worse.
- Exercise 8-15
A student measures the position of a toy car at different moments (table). He draws a graph with the distance $s$ on the horizontal axis and the time $t$ on the vertical axis, and the axes have no quantities or units marked. He reads the slope of the fitted line as $3.3$ and gives it as the speed of the car.
Draw the line fitted to the points the right way round ($t$ on the horizontal axis) and read its slope from two points of the line that are clearly far apart. What is the speed of the car? Answer in m/s and explain what the student's number $3.3$ actually describes.
Position of the toy car $t\,(\text{s})$ $s\,(\text{m})$ 0.0 0.00 2.0 0.62 4.0 1.18 6.0 1.83 8.0 2.39 Answer
$0.30\,\text{m/s}$
Show the solution
Given
the points of the table $(t$; $s)$ = $(0.0\,\text{s}$; $0.00\,\text{m})$, $(2.0\,\text{s}$; $0.62\,\text{m})$, $(4.0\,\text{s}$; $1.18\,\text{m})$, $(6.0\,\text{s}$; $1.83\,\text{m})$, $(8.0\,\text{s}$; $2.39\,\text{m})$; the slope read by the student is $3.3$
Find
the speed $v$ of the car in $\text{m/s}$ and what the number $3.3$ describes
Principle
In uniform motion $s = vt$, so when time is on the horizontal axis and distance on the vertical axis, the slope of the line is the speed. The student swapped the axes: when distance is on the horizontal axis, the slope is $\Delta t / \Delta s = 1/v$, the reciprocal of the speed. In addition, the axes lacked quantities and units, so no meaning can be given to the number $3.3$.
Reading the graph
The points lie almost on a line through the origin. The fitted line passes, for example, through the points $(2.0\,\text{s}$; $0.60\,\text{m})$ and $(8.0\,\text{s}$; $2.40\,\text{m})$. The slope is read from two points of the line, not from two adjacent measurement points.
Formula
$v = \dfrac{s_2 - s_1}{t_2 - t_1}$
Conversions
The distance is in metres and the time in seconds, so no conversions are needed.
Substitution
$v$$= \dfrac{2.40\,\text{m} - 0.60\,\text{m}}{8.0\,\text{s} - 2.0\,\text{s}}$$= \dfrac{1.80\,\text{m}}{6.0\,\text{s}}$$= 0.30\,\text{m/s}$Answer
$0.30\,\text{m/s}$
Two significant figures like the points read. The student's number $3.3$ is a reciprocal: $\dfrac{1}{0.30\,\text{m/s}} = 3.3\,\text{s/m}$. In a correctly drawn graph $t$ is on the horizontal axis and $s$ on the vertical axis, and the axes have a quantity and a unit, for example $t\,(\text{s})$ and $s\,(\text{m})$.
Reasonableness
The measurement points grow by about $0.6\,\text{m}$ every two seconds, that is, about $0.3\,\text{m/s}$. The result is of the order of the speed of a toy car.
Level 3 · challenging 5 exercises
Optional: application, two ideas together or a new situation where you reason for yourself.
- Exercise 8-16
A student fits two lines to the measurement points (distance as a function of time): the steepest, whose slope is $0.463\,\text{m/s}$, and the shallowest, whose slope is $0.397\,\text{m/s}$. The measurement points fit between these lines. Half of the difference of the slopes of the lines is taken as the uncertainty.
How large is the uncertainty of the speed?
Answer
$0.033\,\text{m/s}$
Show the solution
Given
slope of the steepest line $v_\text{max} = 0.463\,\text{m/s}$, of the shallowest $v_\text{min} = 0.397\,\text{m/s}$
Find
the uncertainty $\Delta v$ of the speed in $\text{m/s}$
Principle
All lines that fit the data points within their uncertainties are plausible, so the speed is probably between the slopes of the steepest and the shallowest line. The best estimate is their mean, and the uncertainty is half of the difference.
Formula
$v$$= \dfrac{v_\text{max} + v_\text{min}}{2}$$\Delta v$$= \dfrac{v_\text{max} - v_\text{min}}{2}$Conversions
The slopes are already in the same unit, $\text{m/s}$, so no conversions are needed.
Substitution
$\Delta v$$= \dfrac{0.463\,\text{m/s} - 0.397\,\text{m/s}}{2}$$= \dfrac{0.066\,\text{m/s}}{2}$$= 0.033\,\text{m/s}$Answer
$0.033\,\text{m/s}$
(calculated value; the difference $0.066\,\text{m/s}$ is a two-figure number). As a stated uncertainty it is rounded to one significant figure, so the speed is $v = 0.43\,\text{m/s} \pm 0.03\,\text{m/s}$. The answer field accepts both.
Reasonableness
The uncertainty is about $\tfrac{0.033}{0.430} \approx 8\,\%$ of the speed, which suits motion measured with a hand stopwatch. If the hypothesis predicted $0.50\,\text{m/s}$, it would be more than two uncertainties above the measured value: the interval is $0.397$–$0.463\,\text{m/s}$, and the prediction does not fit in it.
- Exercise 8-17
Hot water cools in a cup. The temperature is $80.0\,{}^\circ\text{C}$ at $t = 0\,\text{min}$, $68.0\,{}^\circ\text{C}$ at $5.0\,\text{min}$, $52.0\,{}^\circ\text{C}$ at $15.0\,\text{min}$ and $47.0\,{}^\circ\text{C}$ at $20.0\,\text{min}$. The student's hypothesis is that the temperature falls steadily.
How much greater is the rate of temperature fall during the first five minutes than during the last five minutes? Answer in K/min.
Answer
$1.4\,\text{K/min}$
Show the solution
Given
temperatures $80.0\,{}^\circ\text{C}$ at time $0\,\text{min}$, $68.0\,{}^\circ\text{C}$ at $5.0\,\text{min}$, $52.0\,{}^\circ\text{C}$ at $15.0\,\text{min}$ and $47.0\,{}^\circ\text{C}$ at $20.0\,\text{min}$
Find
the difference between the rates of fall during the first and the last five minutes in $\text{K/min}$
Principle
The hypothesis "the temperature falls steadily" predicts the same rate of fall everywhere. So calculate the rate of fall for two periods and compare them. A temperature change is the same in kelvins and in degrees Celsius.
Formula
$r$$= \dfrac{T_\text{start} - T_\text{end}}{\Delta t}$$\Delta r = r_1 - r_2$
Conversions
A fall in temperature in degrees Celsius equals the fall in kelvins, so a change of $1\,{}^\circ\text{C}$ is $1\,\text{K}$ and no conversion is needed.
Substitution
$r_1$$= \dfrac{80.0\,{}^\circ\text{C} - 68.0\,{}^\circ\text{C}}{5.0\,\text{min}}$$= \dfrac{12.0\,\text{K}}{5.0\,\text{min}}$$= 2.4\,\text{K/min}$$r_2$$= \dfrac{52.0\,{}^\circ\text{C} - 47.0\,{}^\circ\text{C}}{5.0\,\text{min}}$$= \dfrac{5.0\,\text{K}}{5.0\,\text{min}}$$= 1.0\,\text{K/min}$so
$\Delta r$$= 2.4\,\text{K/min} - 1.0\,\text{K/min}$$= 1.4\,\text{K/min}$Answer
$1.4\,\text{K/min}$
Two significant figures, because the temperature differences are $12.0\,\text{K}$ and $5.0\,\text{K}$.
Reasonableness
The first rate of fall is more than twice the last one, and this difference cannot come from a reading error of $0.1\,\text{K}$ alone. So the hypothesis of a steady fall does not hold: the temperature falls more slowly the closer the water is to room temperature.
- Exercise 8-18
60 minutes have been set aside for an investigation. Assembling and testing the equipment takes 12 minutes, and the measurement is made at six different distances. Each measurement repeat takes 2.0 minutes, including returning to the start and recording.
How many repeats can be done for each distance, when the number of repeats is the same at every distance?
Answer
$4.0$
Show the solution
Given
total time $60\,\text{min}$, preparation $12\,\text{min}$, number of distances $N = 6$, one repeat $2.0\,\text{min}$
Find
the number of repeats $n$ for each distance
Principle
The time available for measuring is the total time minus the preparation. It is divided equally among all the repeats: there are $n$ repeats at each of the $N$ distances, and each repeat takes the same time.
Formula
$t_\text{tot} - t_\text{prep} = N\, n\, t_\text{rep}$, so
$n$$= \dfrac{t_\text{tot} - t_\text{prep}}{N\, t_\text{rep}}$Conversions
All times are in minutes, so no conversions are needed.
Substitution
$n$$= \dfrac{60\,\text{min} - 12\,\text{min}}{6 \cdot 2.0\,\text{min}}$$= \dfrac{48\,\text{min}}{12\,\text{min}}$$= 4.0$Answer
$4.0$
Repeats, two significant figures like the duration of a repeat. The number of repeats must be a whole number, and here the result is exactly four.
Reasonableness
Four repeats at six distances make 24 measurements, and $24 \cdot 2.0\,\text{min} = 48\,\text{min}$ plus the preparation of $12\,\text{min}$ gives $60\,\text{min}$. No time is wasted and there is no overrun.
- Exercise 8-19
A student investigated whether the mass of a ball affects the rolling time (compare the measurements of the light and heavy ball). The results of five repeats are the means $\bar{t}_{50} = 3.12\,\text{s} \pm 0.04\,\text{s}$ and $\bar{t}_{200} = 3.08\,\text{s} \pm 0.04\,\text{s}$ (the uncertainty is half of the range). The uncertainty of timing with a hand stopwatch was estimated at $0.15\,\text{s}$ for a single measurement.
The discussion says: “The experiment went well. The mean of the heavy ball is smaller, so the hypothesis was correct. There were few errors.”
How many times the difference of the means is the hand-timing uncertainty $0.15\,\text{s}$? Use this and the intervals of the results to justify which claims of the discussion the data supports and which it does not, and write two better sentences for the discussion.
Means of the travel times of the light and the heavy ball Ball $\bar{t}\,(\text{s})$ $\Delta t\,(\text{s})$ $50\,\text{g}$ 3.12 0.04 $200\,\text{g}$ 3.08 0.04 Answer
$3.8$
Show the solution
Given
$\bar{t}_{50} = 3.12\,\text{s} \pm 0.04\,\text{s}$, $\bar{t}_{200} = 3.08\,\text{s} \pm 0.04\,\text{s}$; hand-timing uncertainty $\Delta t_\text{hand} = 0.15\,\text{s}$; the claims of the discussion “the experiment went well”, “the hypothesis was correct” and “there were few errors”
Find
how many times the difference of the means is $\Delta t_\text{hand}$, and which claims the data supports
Principle
The discussion evaluates what the results show and how reliable they are. A claim is supported only if the difference is greater than the uncertainty, that is, if the uncertainty intervals do not overlap. An experiment is not said to prove a hypothesis for certain, and the sentence “there were few errors” must not be left without numbers.
Formula
$\Delta \bar{t} = \bar{t}_{50} - \bar{t}_{200}$ and the ratio
$k$$= \dfrac{\Delta t_\text{hand}}{\Delta \bar{t}}$Conversions
All times are in seconds, so no conversions are needed.
Substitution
$\Delta \bar{t}$$= 3.12\,\text{s} - 3.08\,\text{s}$$= 0.04\,\text{s}$so
$k$$= \dfrac{0.15\,\text{s}}{0.04\,\text{s}}$$= 3.75$$\approx 3.8$The intervals are $3.08$–$3.16\,\text{s}$ and $3.04$–$3.12\,\text{s}$, and they overlap in the interval $3.08$–$3.12\,\text{s}$.
Answer
about $3.8$ times. The data does not support the claim “the hypothesis was correct”, because the difference $0.04\,\text{s}$ is as large as the uncertainty $0.04\,\text{s}$ and the intervals overlap; a smaller mean alone is not enough. The claim “there were few errors” does not hold either: the hand-timing uncertainty is a multiple of the difference. The claim “the experiment went well” is too strong, because the experiment could not show a difference. Better sentences: “The difference of the means $0.04\,\text{s}$ is as large as the uncertainty $0.04\,\text{s}$, so the data does not show a difference in the travel times of the balls; however, this does not prove that mass has no effect.” and “The hand-timing uncertainty $0.15\,\text{s}$ is about $3.8$ times the difference, so in future a photogate should be used and the number of repeats increased.”
Reasonableness
When the uncertainty of the hand stopwatch is a multiple of the measured difference, a small difference ($0.04\,\text{s}$, about $1.3\,\%$ of the time) cannot stand out from the measurement error. The conclusion “no difference can be shown” is therefore suitably cautious. No deviating measurement was removed and the hypothesis was not declared certain.
- Exercise 8-20
A student plans an investigation for the question “Does the cooling rate of water depend on the material of the container?” He pours the same number of decilitres of $80\,{}^\circ\text{C}$ water into three containers of the same size (glass, metal, plastic) and reads the temperature every minute. The independent (manipulated) variable is the material of the container and the dependent variable is the fall in temperature.
The temperatures of the glass container in a preliminary experiment are in the table. Estimate the initial cooling rate from the change during the first three minutes of the table. The uncertainty of the fall in temperature $\Delta T_\text{fall}$ is estimated at $1.0\,\text{K}$, and the relative uncertainty of the fall is wanted to be at most $5.0\,\%$. Assume that even in the container that cools most slowly the initial rate is about the same as in the glass container.
How long must the measurement period be planned to be at least? Also name three variables to be controlled, with reasons, and tell how the cooling curves of the three containers are compared.
Temperature of the water in the glass container $t\,(\text{min})$ $T\,({}^\circ\text{C})$ 0.0 80.0 1.0 77.9 2.0 76.0 3.0 74.0 4.0 72.2 Answer
$10\,\text{min}$
Show the solution
Given
temperatures of the preliminary experiment in the glass container: $80.0\,{}^\circ\text{C}$ at $0.0\,\text{min}$ and $74.0\,{}^\circ\text{C}$ at $3.0\,\text{min}$; uncertainty of the fall $\Delta T_\text{fall} = 1.0\,\text{K}$, largest allowed relative uncertainty $\varepsilon_\text{max} = 5.0\,\%$
Find
the minimum length $t$ of the measurement period in $\text{min}$, three variables to be controlled and the way of comparing the cooling curves
Principle
The initial cooling rate is estimated from the change during the first three minutes of the table. The relative uncertainty stays within the limit only if the measured fall is large enough compared with the uncertainty, just as in a time measurement where the uncertainty of the time is constant. First the smallest sufficient fall is calculated, and then the time in which the water cools by this amount at the initial rate.
Formula
$r$$= \dfrac{T_\text{start} - T_3}{\Delta t}$$\;\varepsilon$$= \dfrac{\Delta T_\text{fall}}{T_\text{fall}}$$\le \varepsilon_\text{max}$from which
$T_\text{fall}$$\ge \dfrac{\Delta T_\text{fall}}{\varepsilon_\text{max}}$$t = \dfrac{T_\text{fall}}{r}$
Conversions
A percent is a hundredth: $5.0\,\% = 0.050$. A fall in temperature is the same in kelvins and degrees Celsius, so $\text{K}$ is suitable as the unit.
Substitution
$r$$= \dfrac{80.0\,{}^\circ\text{C} - 74.0\,{}^\circ\text{C}}{3.0\,\text{min}}$$= \dfrac{6.0\,\text{K}}{3.0\,\text{min}}$$= 2.0\,\text{K/min}$Then
$T_\text{fall}$$\ge \dfrac{1.0\,\text{K}}{0.050}$$= 20\,\text{K}$so
$t$$= \dfrac{20\,\text{K}}{2.0\,\text{K/min}}$$= 10\,\text{min}$Answer
at least $10\,\text{min}$, two significant figures like the given values. Variables to be controlled: the amount of water (otherwise the heat capacity and the surface area change), the initial temperature of the water (the cooling rate depends on the temperature difference to the room) and the surroundings, that is, the temperature of the room and the air flow, and whether there is a lid or not. The curves are drawn in the same graph and compared by their initial slopes (the cooling rate for the same fall in temperature $\Delta T$, for example during the first $20\,\text{K}$ fall), taking the uncertainty into account.
Reasonableness
The fall in temperature must be $20\,\text{K}$, which is 20 times the uncertainty $1.0\,\text{K}$, so the relative uncertainty is $\tfrac{1}{20} = 5\,\%$. In reality cooling slows down (compare the earlier cooling exercise), and in the container that cools most slowly the fall is smaller, so $10\,\text{min}$ is a lower limit: the period should be planned longer and checked with a preliminary experiment.
